Customer Patience Analysis in a contact center helps to understand the characteristics of the abandoned calls. It presents the customer patience threshold for each queue, change of customer wait time before abandoning the call for different timeframes and queues. By using customer patience analysis, you can define a target maximum queue wait time to minimize the abandoned calls for each queue.
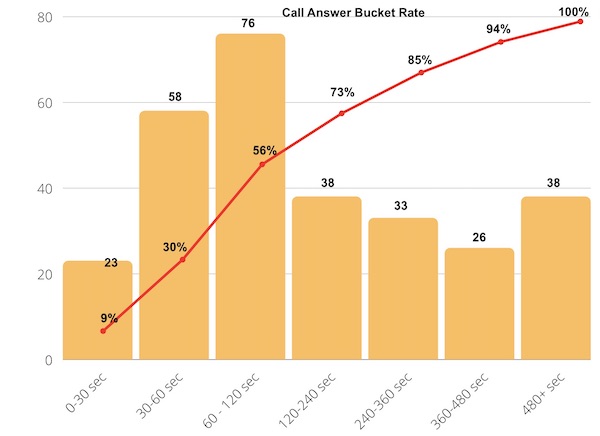
Call Answer Bucket
Starting point for the customer patience analysis is in fact the call answer rate. If your average call answer rate is below your expected percentage, you can analyze further to understand how the calls are abandoned.
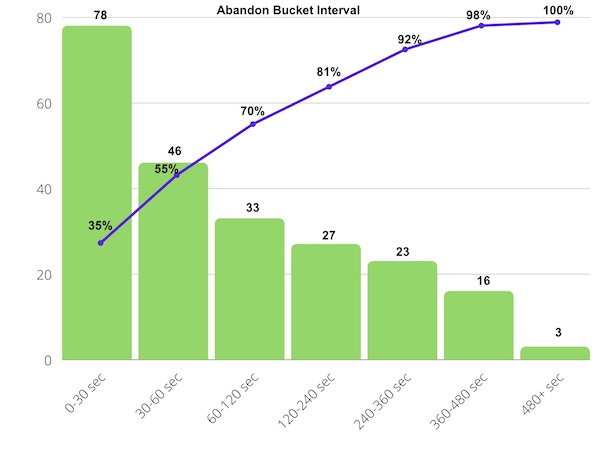
Call Abandon Bucket
Call abandon bucket shows the number of calls abandoned on each bucket interval as well as the total percentage of abandoned calls after each interval. In the given example, 70% of the calls are abandoned within 120 seconds or two minutes. This can be taken as the customer patience threshold and you can plan your resources to bring the queue wait time below that threshold.
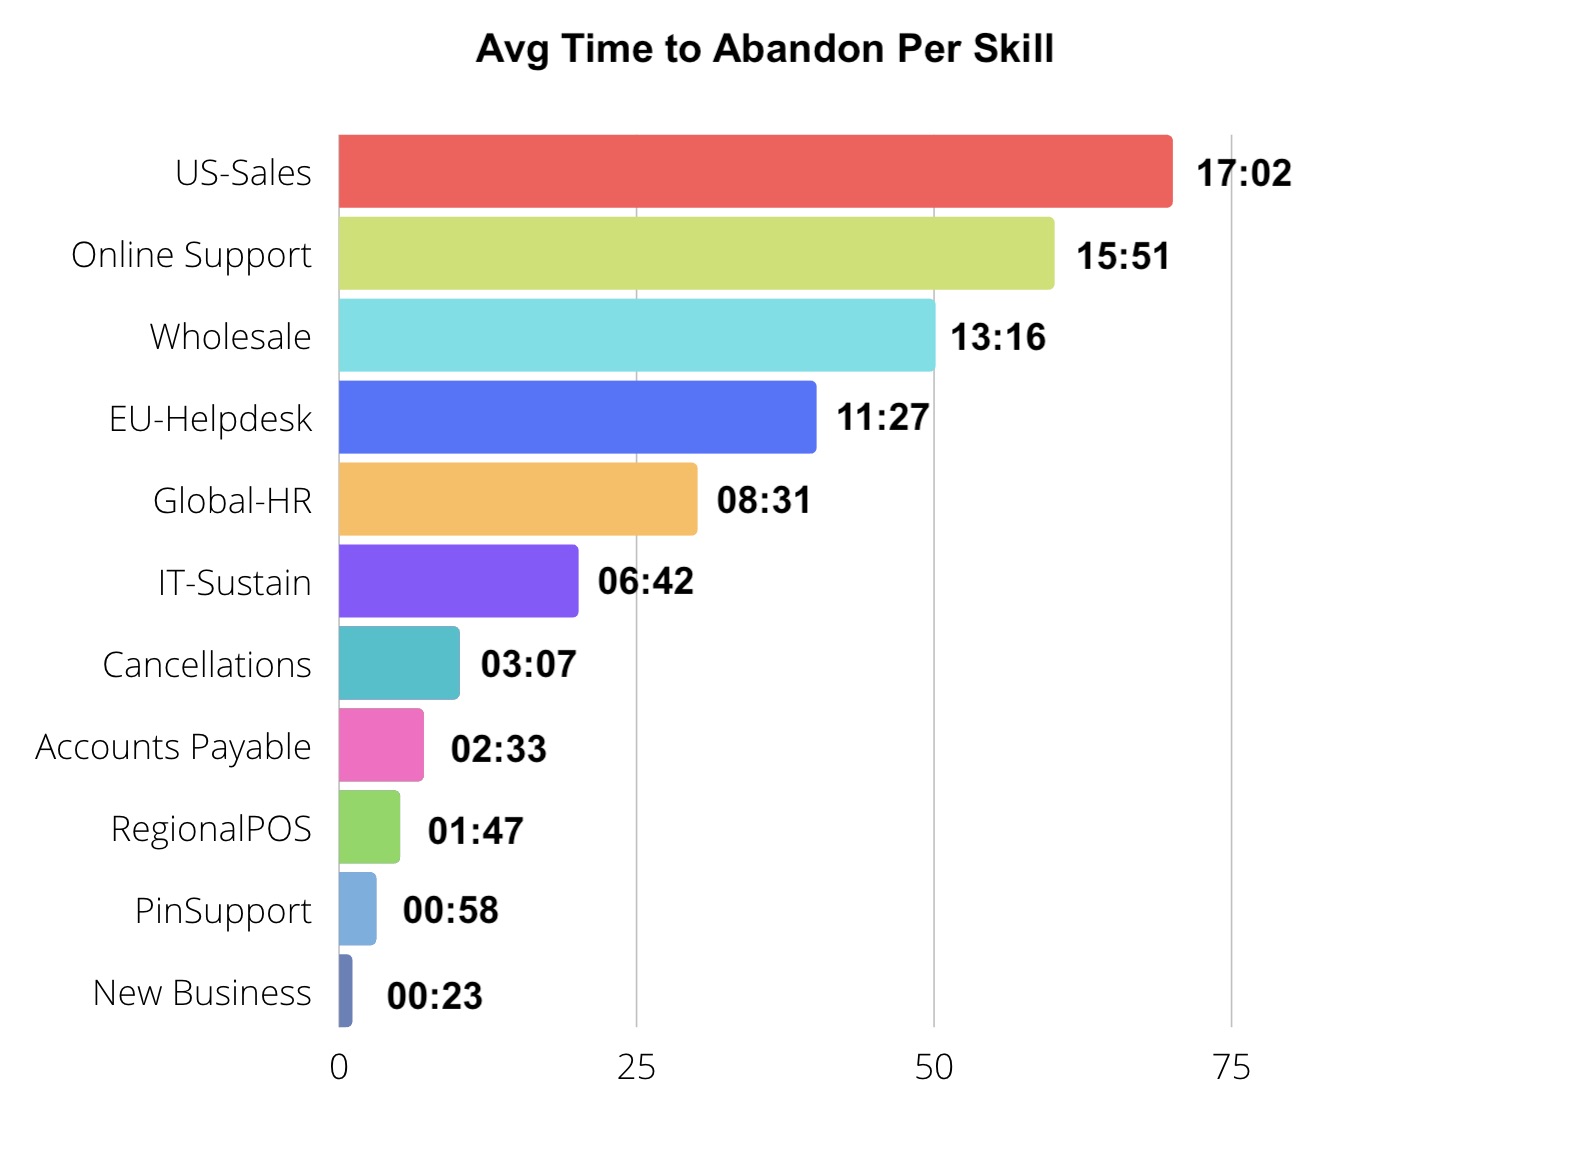
Average Time to Abandon per Skill
By looking at the average time to abandon for each skill, you can identify the top skills with the lowest average wait time before abandon. In the given example, New Business queue has the lowest avg wait time before abandon. This is a skill where prospect customers are calling to get more information and there is a potential revenue generating activity here. More New Business call you answer, more customers you can convert and close sales. So you may need to analyze further to understand which time of the day or day of the week you need more resources and by how much.
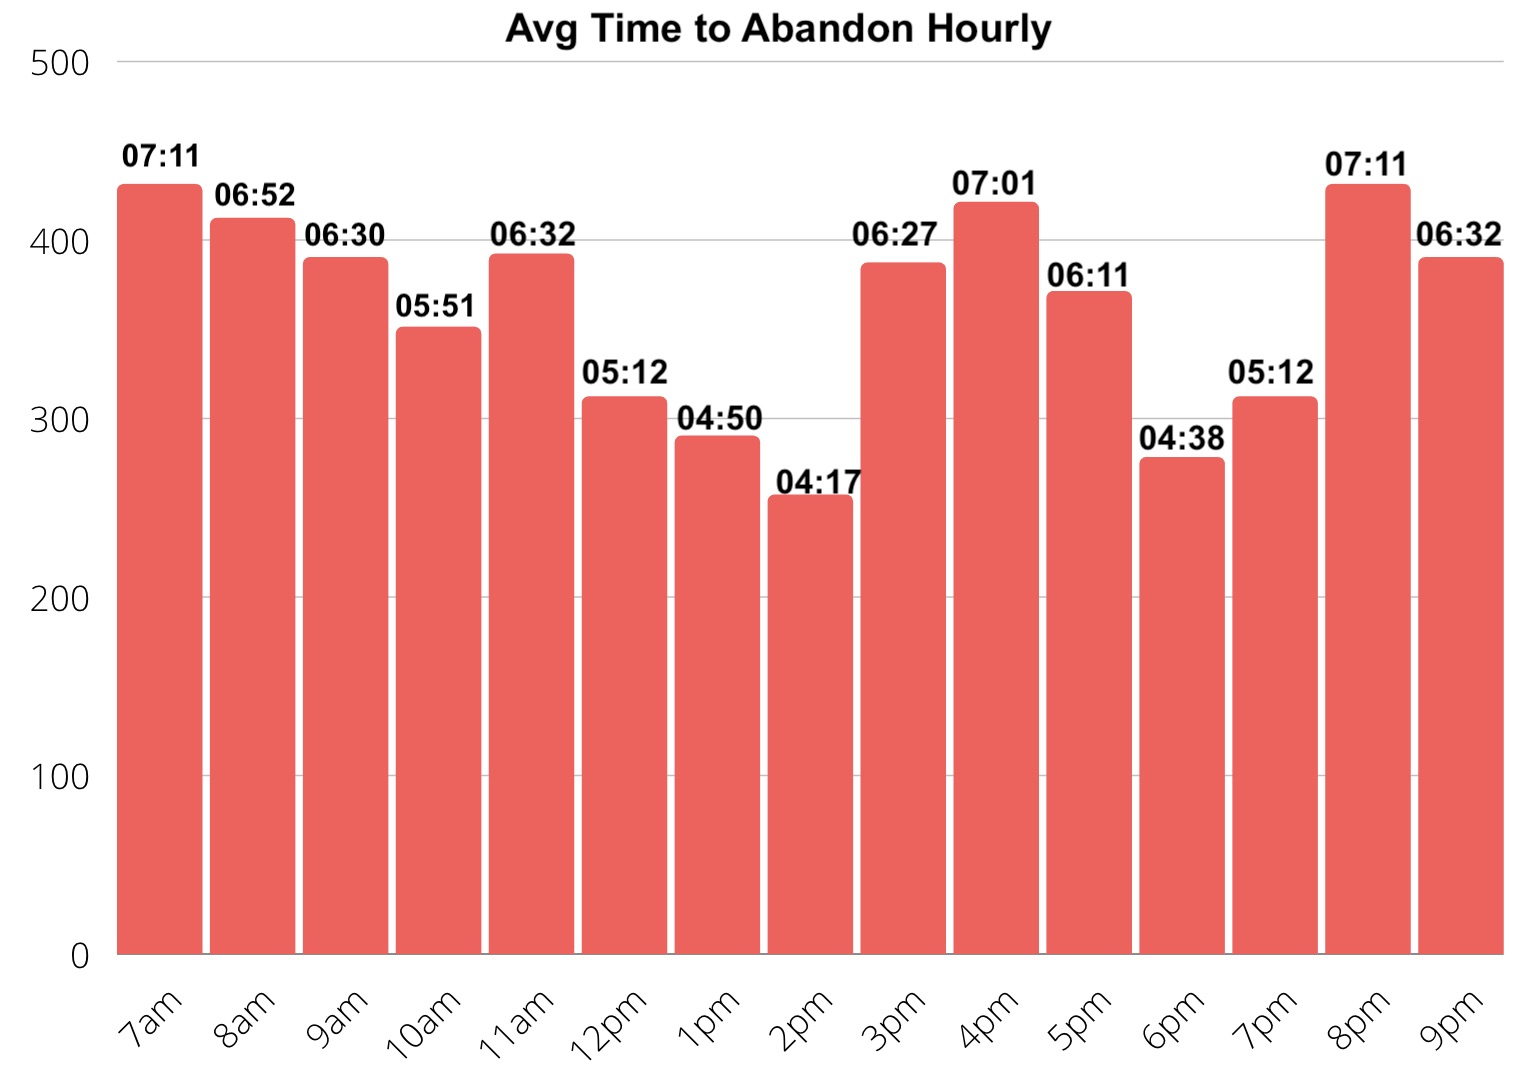
Average Time to Abandon Hourly
Callers may have different wait time patterns during the day before abandoning the call. Hourly view shows the times of the day when the callers are least patient. So you can take this information into consideration and plan your shifts accordingly.
Abandon Wait Time Heatmaps
Heatmap is a weekly chart which shows the value of the selected indicator for the hours of each day in the week. You can run heatmaps for one week or for multiple weeks to see which hours of the day your resources are falling short consistently.
Conclusion
Comstice Quartz Reporting and Analytics platform offers many features to reduce your contact center costs and improve business performance. It is quick to deploy and get up and running within three business days. You can request an on-site trial for Cisco UCCX, Cisco UCCE/PCCE, Amazon Connect, and Avaya CMS and AACC contact centers and experience it with your own data.