The biggest cost in the customer service is the talent cost for the contact centers. Because of the variations in customer service call volumes and call handle times, it is very important to agent occupancy and efficiency. It is important to monitor agent activity as close as the call handling performance.
Contact Center Agent Occupancy and Efficiency Definition:
Contact center agent occupancy is the time when agent was busy; either on a customer call (inbound or outbound) or after call work. In omnichannel operations, this can also include working on other channels such as chat and email as well as handling backoffice tasks such as processing customer mail on the post etc.
Contact center agent efficiency includes all the time spent as occupied and also the time agent was available for customer engagement. This is often referred as "Available" state or "Ready" state in the contact center.

Agent Occupancy and Efficiency Best Practices:
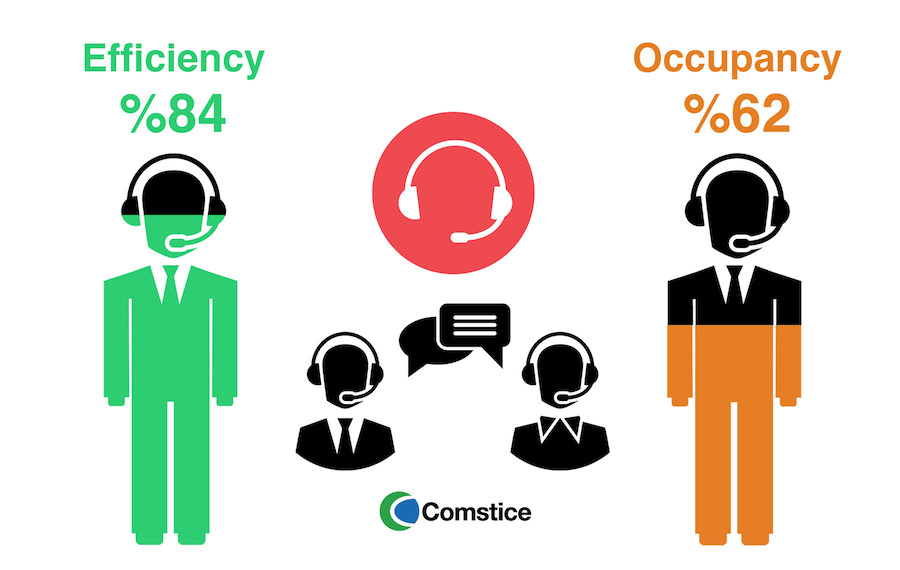
Over the years, we were able to monitor different contact center operations. With the best fine tuning in the agent availability and customer handling service levels, agent occupancy peaks around 60-65%. With all the breaks and other time spent, agent efficiency peaks around 75-80% during the entire shift. These values can be significantly lower if agent efficiency and occupancy are not monitored in the real-time as well as historical reports for the operation.

Real-Time Agent Occupancy and Efficiency
In the real-time dashboards and wallboards, you can monitor below indicators for agent occupancy and efficiency;
- Top 5/10 Agent Efficiency Today
- Top 5/10 Agent Occupancy Today
- Team Agent Efficiency, Occupancy Percentage
- Top 5 Teams Efficiency
- Agent Efficiency Occupancy Hourly Today

Historical Reports for Contact Center Efficiency and Occupancy
You can also monitor agent efficiency and occupancy percentages historically in order to optimize your shift scheduling and workforce management. Below are the indicators and scorecard elements we offer in our solutions for daily, weekly and monthly scorecards for the team and individual agent performance.
- Weekly Heatmaps for Agent Efficiency and Occupancy: It shows hours of the week for one or more weeks so you can see when occupancy and efficiency goes down and up.
- Agent Occupancy Monthly (drills down to weekly and daily
- Not Ready / AUX Reason Analysis: Monitoring the states agent spent the most when they were not efficient
- Top 5/10 Teams Efficiency Daily, Weekly Monthly
- Top 5/10 Agent Efficiency Daily, Weekly Monthly
- Daily Actionable Insights: Min. Agent Efficiency Threshold. You will get the list of agent who were below this threshold on the daily actiobale insights email.
- Daily Actionable Insights: Min. Agent Occupancy Threshold. You will get the list of agent who were below this threshold on the daily actiobale insights email.

Conclusion
Comstice Quartz Reporting and Analytics platform offers many features to reduce your contact center costs and improve business performance. It is quick to deploy and get up and running within three business days. You can request an on-site trial for Cisco UCCX, Cisco UCCE/PCCE, Amazon Connect, and Avaya CMS and AACC contact centers and experience it with your own data.