This document provides the details of Comstice Wallboard Widgets available for Cisco UCCE. Some widgets have additional controls such as threshold values as well as the start and end time for the hourly charts. It is also possible to enable audio alerts so that when the second threshold is hit, an audio file of your choice will play in the period that you set.
-
Agent Widgets
Agent Widgets
Agent widgets show the real-time and daily historical information about the logged in agents. There are two types of widgets the agents;
Information about agent's state and the stats related to agent's reason codes
Agent call statistics
The widgets can be a list of individual agents, grouped agents per state, team or other parameters and agent rankings such as Top 10 Calls answered or RONA.
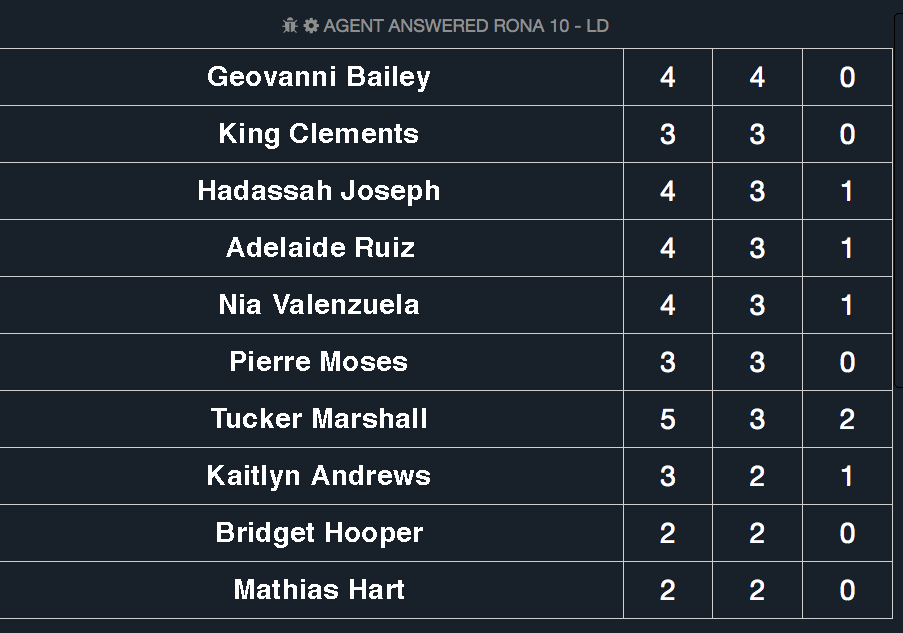
Agent Answered RONA 5, 10, 30
![Comstice Wallboard Widgets for Cisco UCCE]()
This widget shows the first 5, 10 or 30 agents from the selected agent list. First column is the received calls, second is answered and the last column is the abandoned calls at the agent level also known as RONA (Reroute On No Answer). Those calls are sent to the agent but taken back to the queue since agent failed to answer on time.
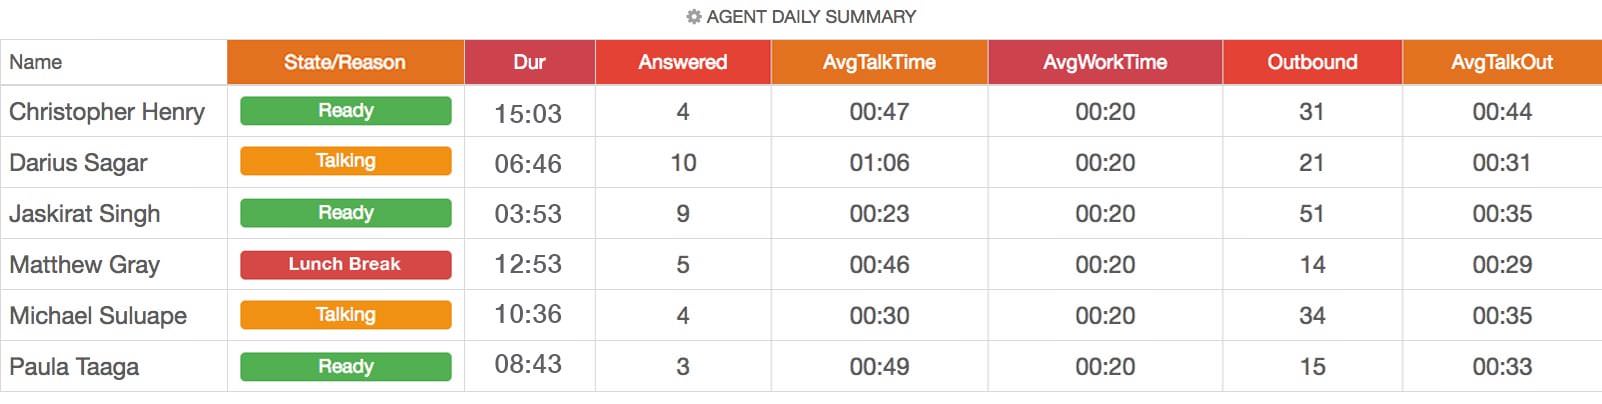
Agent Daily Summary
![Comstice Wallboard Widgets for Cisco UCCE]()
This widget retrieves the data from Cisco UCCE database historical tables. It shows the state, state duration, calls answered, average talk time, average work time, outbound calls and average outbound talk time. Outbound calls are the calls generated by the agent manually to internal and external numbers.
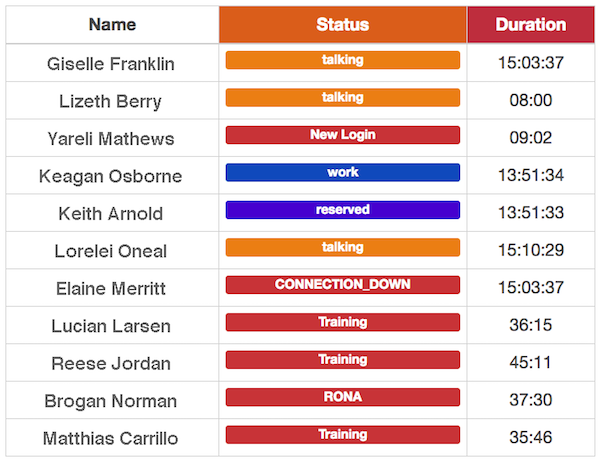
Agent List 5, 10, 20, 30
![Comstice Wallboard Widgets for Cisco UCCE]()
This widget lists the first 5, 10, 20 or 30 agents from the selected agents in the settings. Numbers 5,10,20 and 30 represent the maximum number of agents to be displayed.
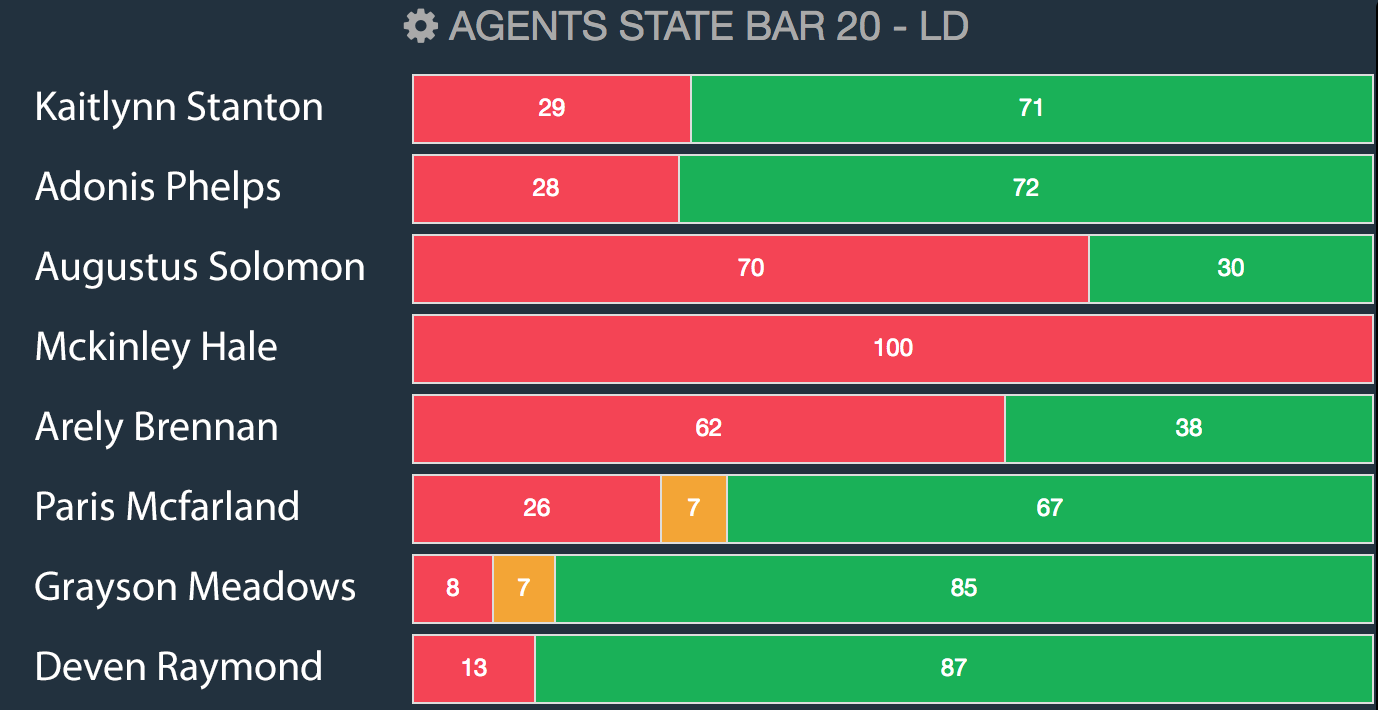
Agents 20 and 30 displays two separate tables so Layout 9 is the most suitable layout for these widgets.Agent State Bars 10, 20, 30
![Comstice Wallboard Widgets for Cisco UCCE]()
Agent State Bars show the percentage of state each agent has spent during the day when they we logged in. It includes all the login time during the day even though agent has logged out and logged back in several times.
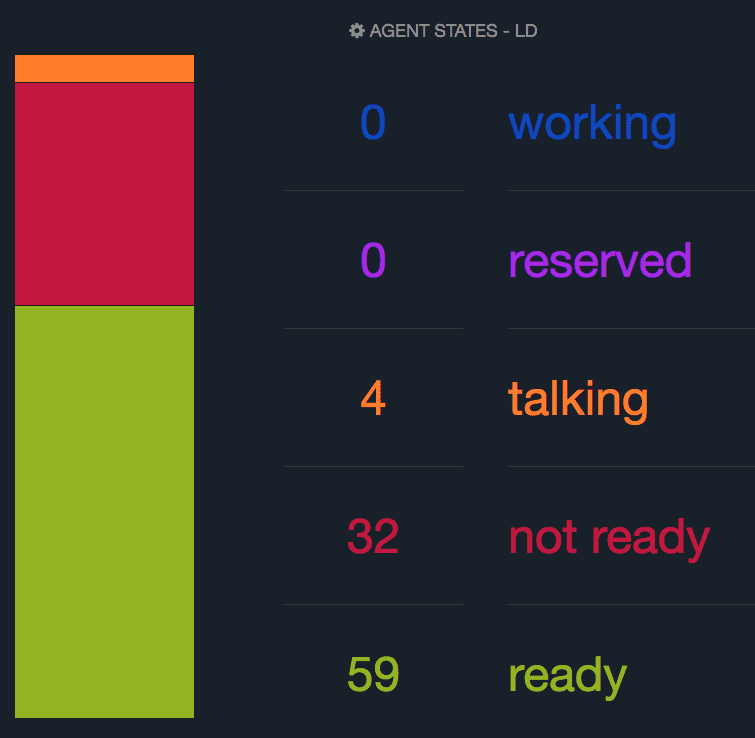
Agent States
![Comstice Wallboard Widgets for Cisco UCCE]()
This widget lists the number of agents in each state for the logged in agents from the selected agent list.
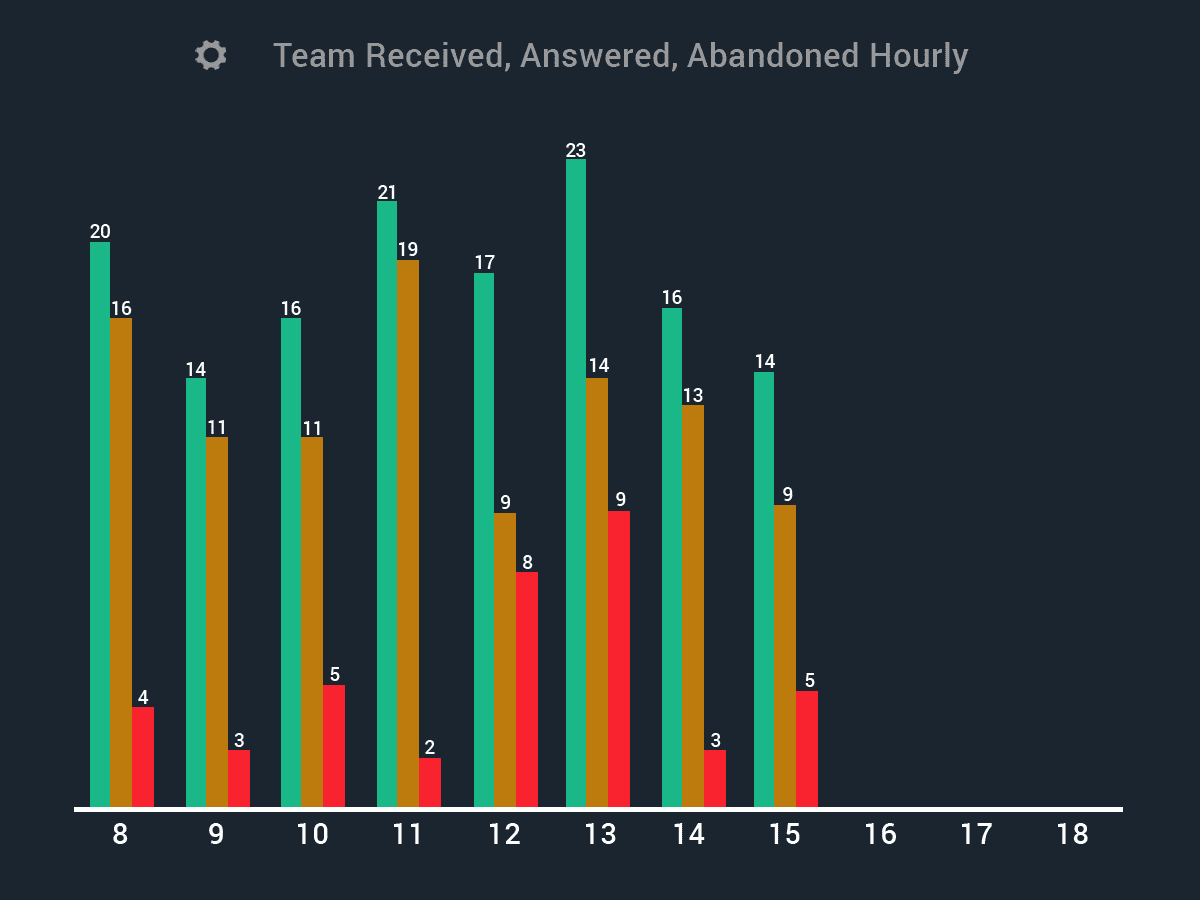
Agent Team Received, Answered and Abandoned Hourly
![Comstice Wallboard Widgets for Cisco UCCE]()
Hourly chart that shows the calls received, answered and abandoned (RONA) by the selected agents.
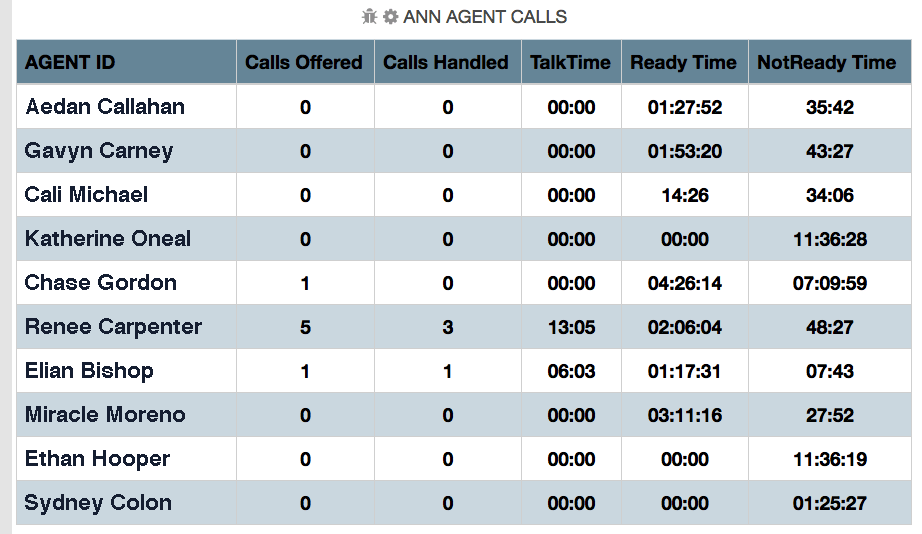
ANN Agent Calls
![Comstice Wallboard Widgets for Cisco UCCE]()
This widget shows the calls offered and handled (answered) by each agent as well as the total talk time, total ready and not ready time. Only logged in agents are displayed.
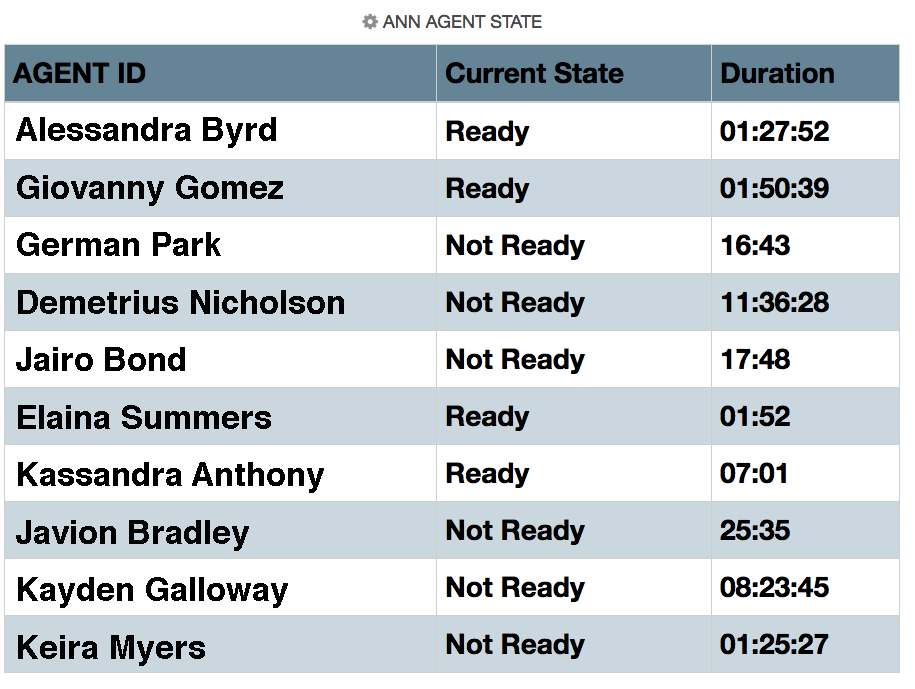
ANN Agent State
![Comstice Wallboard Widgets for Cisco UCCE]()
This widget shows the list of agents with their states and state durations.This information is gathered from Cisco UCCE database historical tables.
Average Login Percentage Hourly
![Comstice Wallboard Widgets for Cisco UCCE]()
Average number of FTEs based on the login time of the selected agents on each hour. This is a weighted average using total FTEs logged in at each hour.
Dialer Agents Calls Answered 10 20
![Comstice Wallboard Widgets for Cisco UCCE]()
This widget lists the current state and duration of the selected outbound agents.
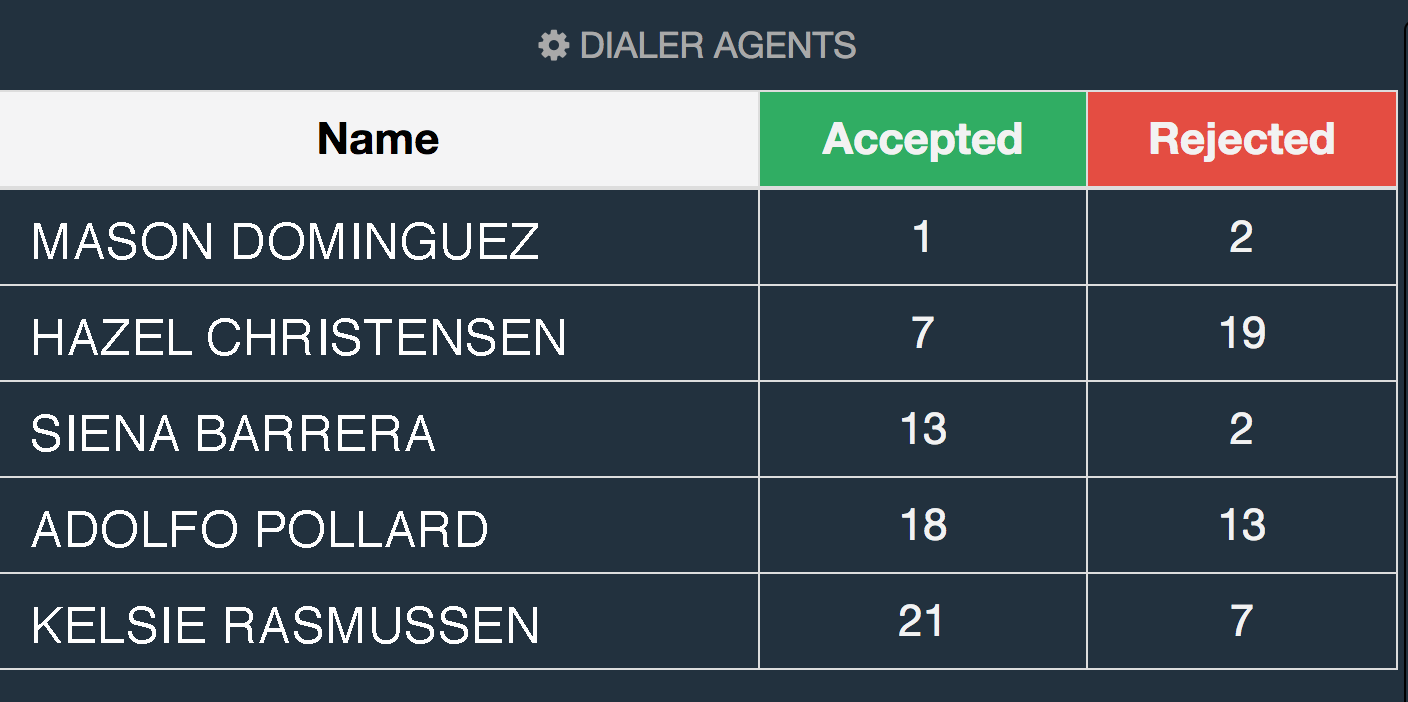
Dialer Agents Realtime
![Comstice Wallboard Widgets for Cisco UCCE]()
This shows a table with each outbound dialer agent and the number of calls they accepted and rejected from the campaign.
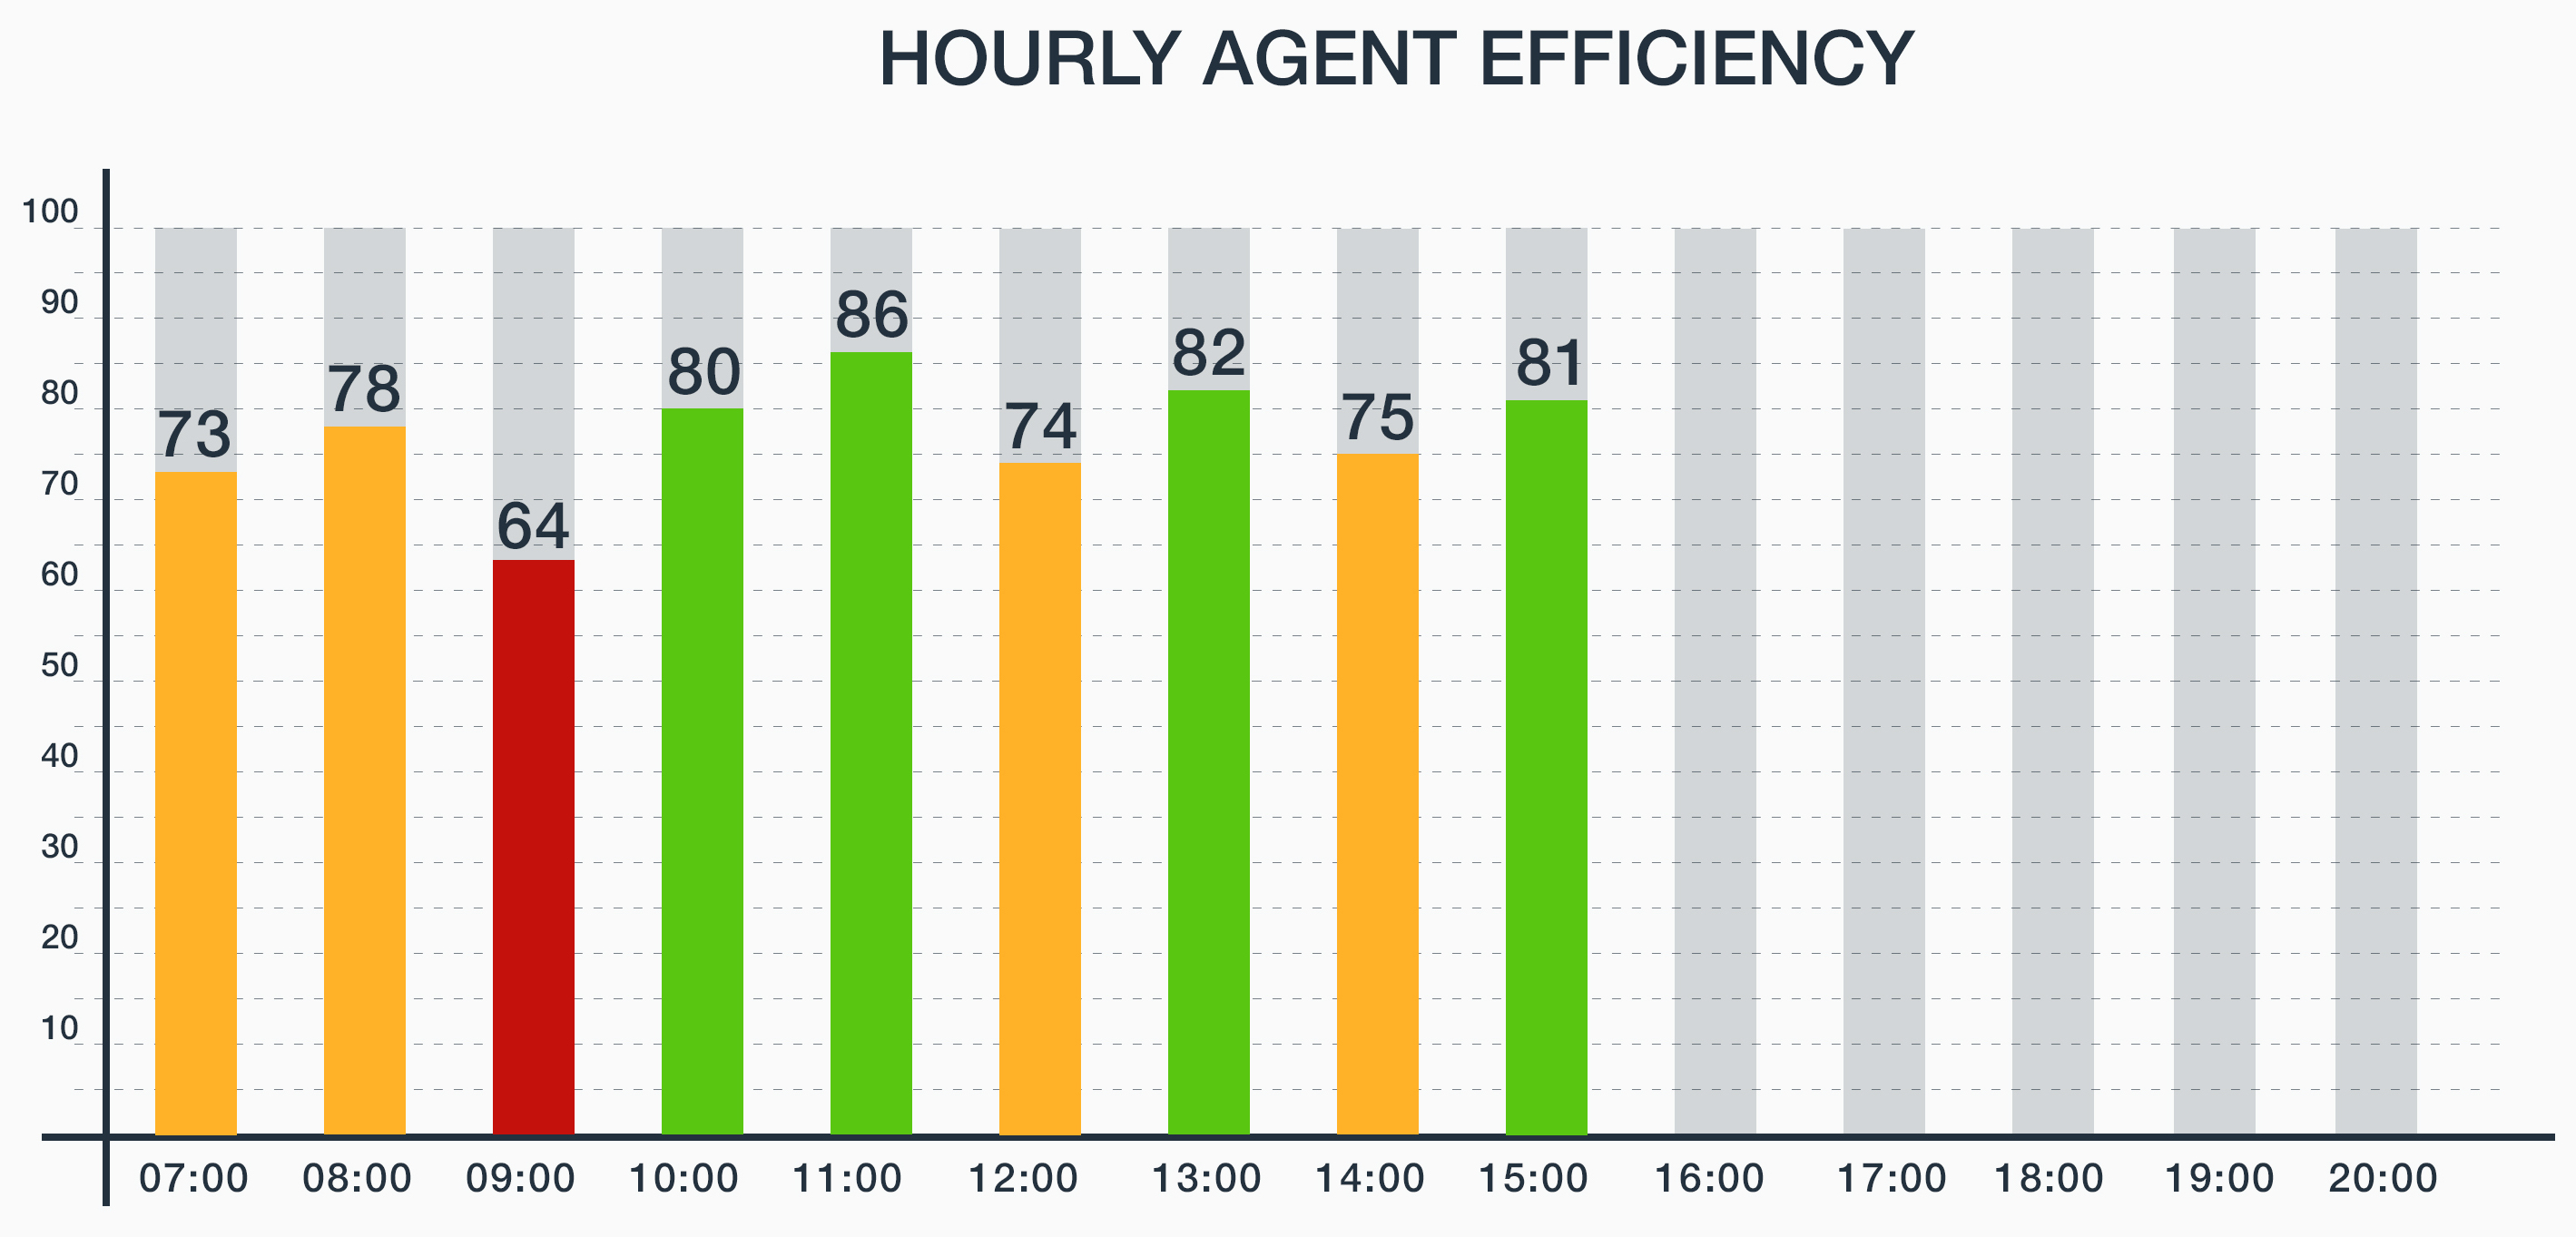
Hourly Agent Efficiency
![Comstice Wallboard Widgets for Cisco UCCE]()
Percentage of the time selected agents spent efficiently during their loggedin time for each hour in the day. Efficiency is based on the criteria configured by the team leaders and assigned to each team.
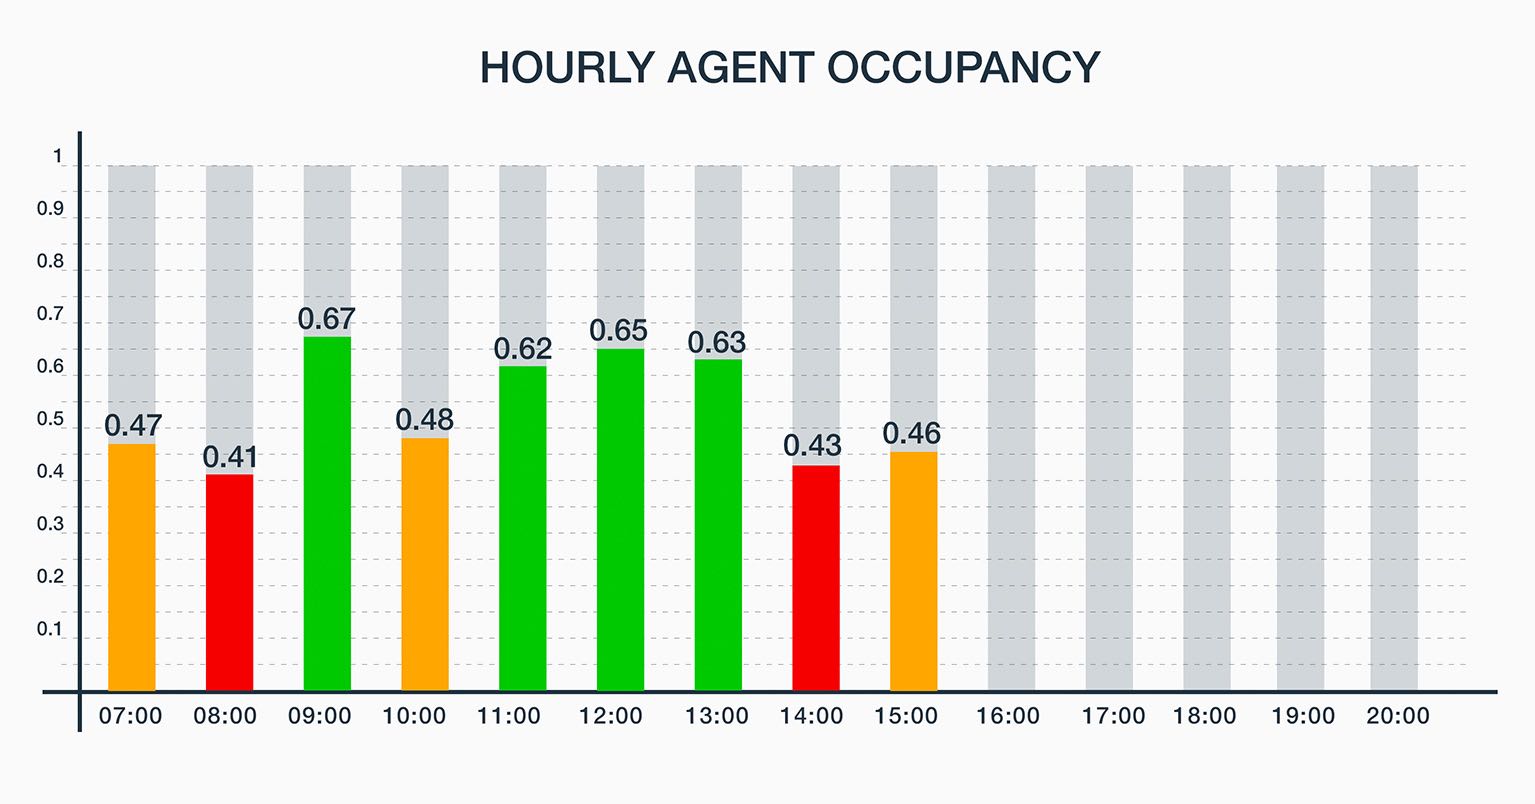
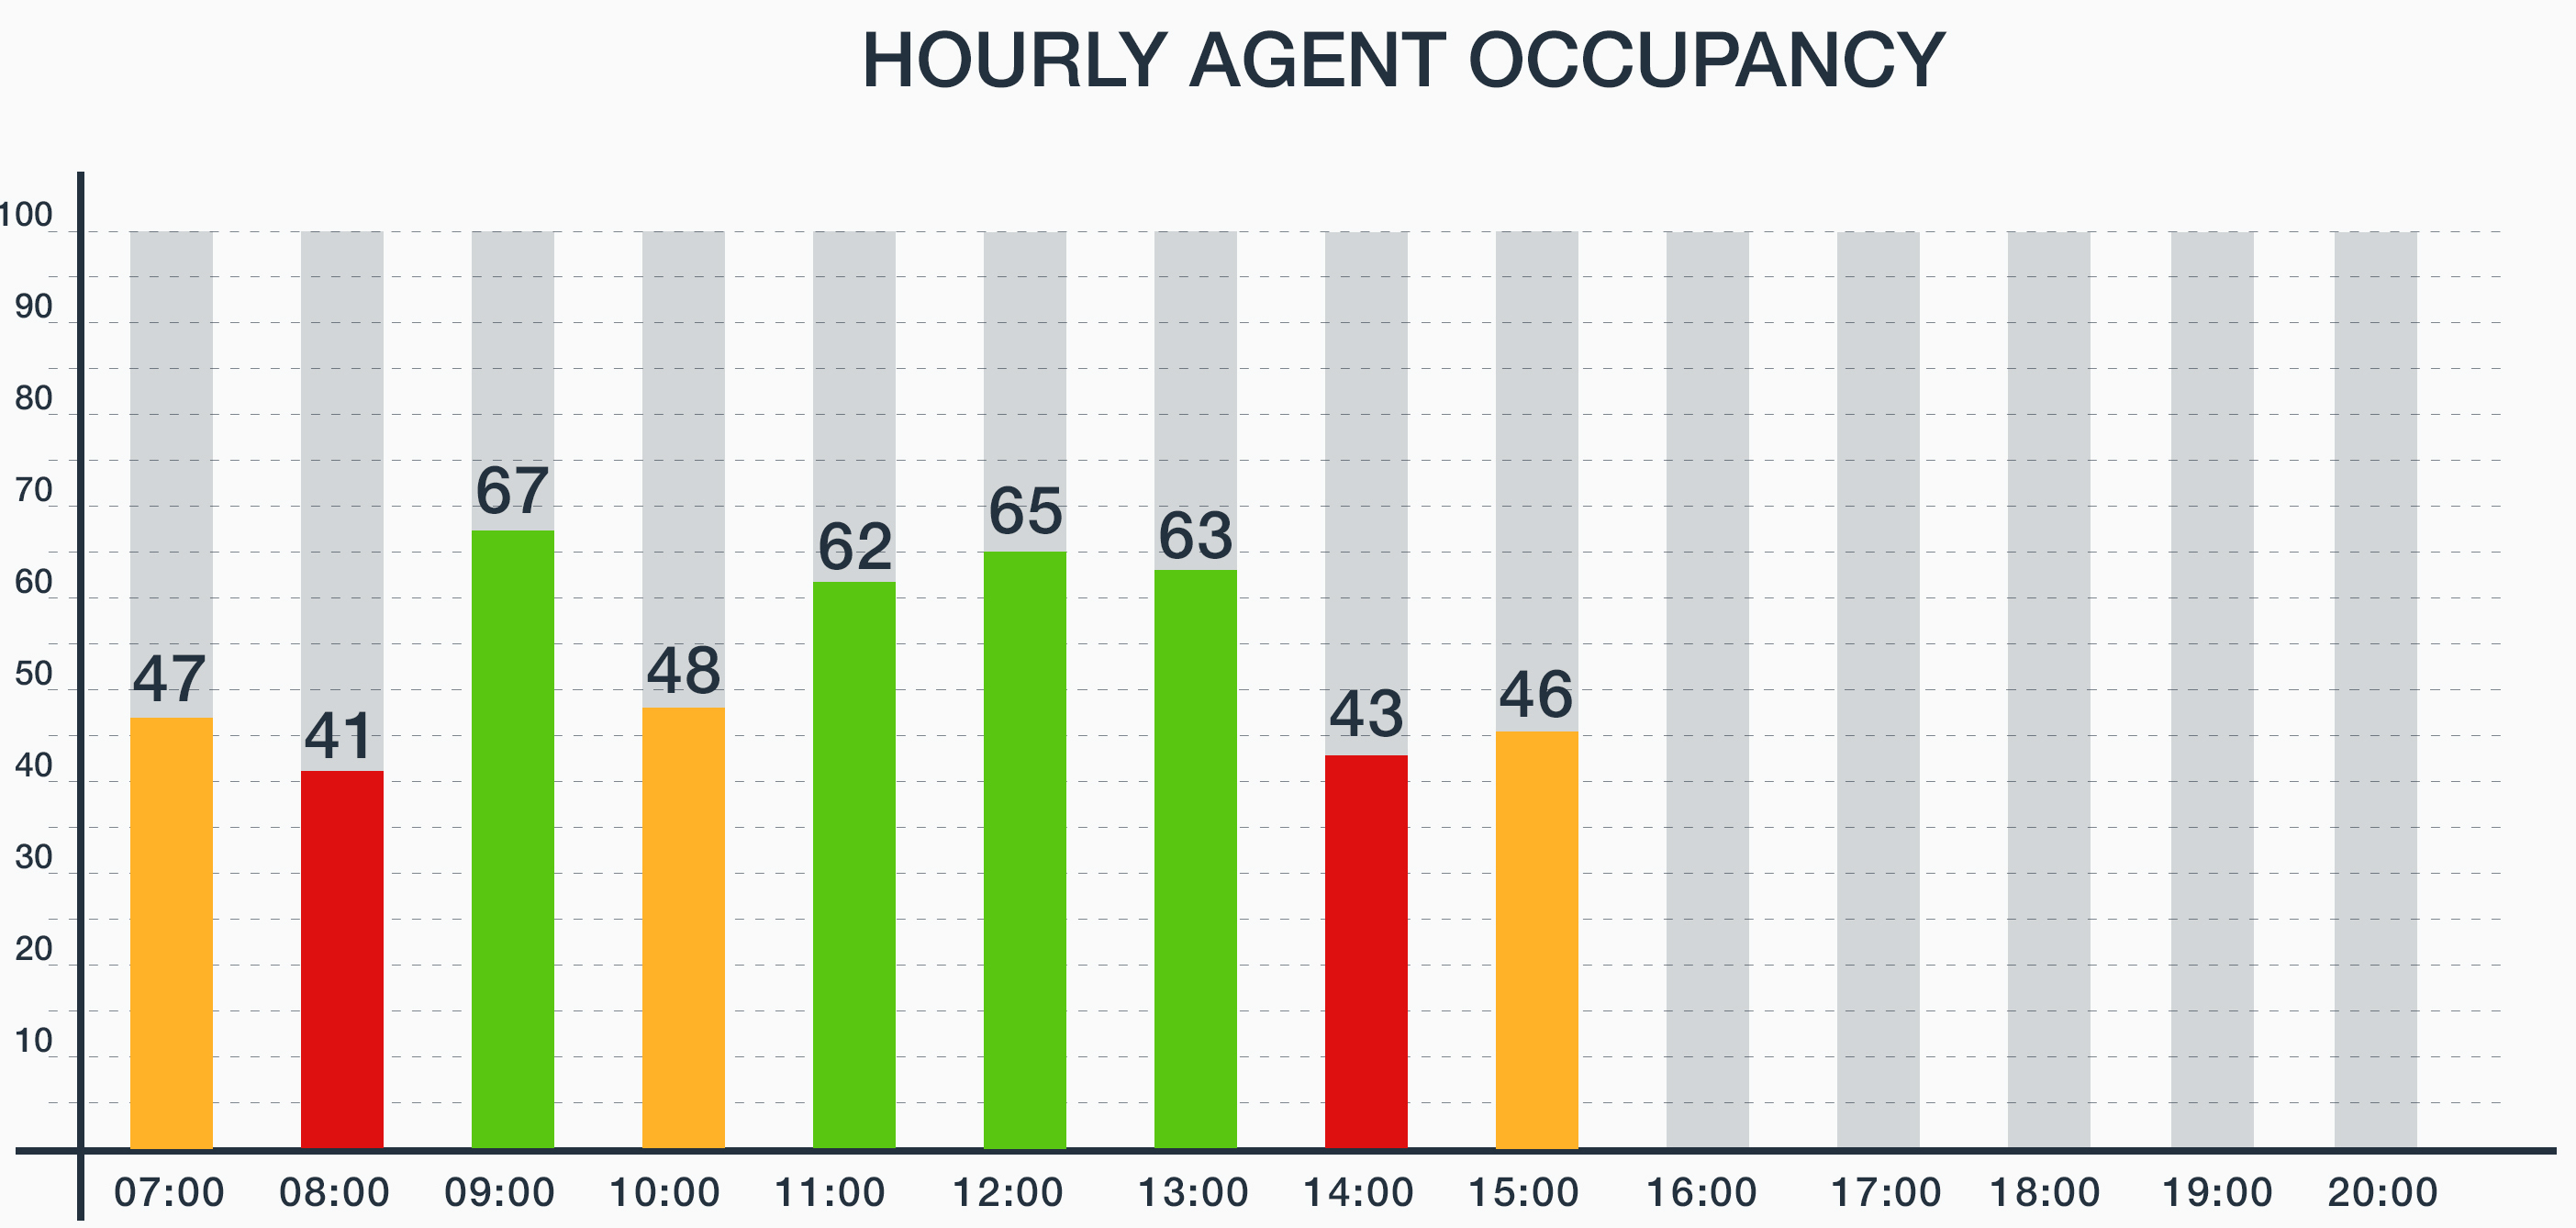
Hourly Agent Occupancy
![Comstice Wallboard Widgets for Cisco UCCE]()
Percentage of the time selected agents spent as occupant during their loggedin time for each hour in the day. Occupancy is based on the criteria configured by the team leaders and assigned to each team.
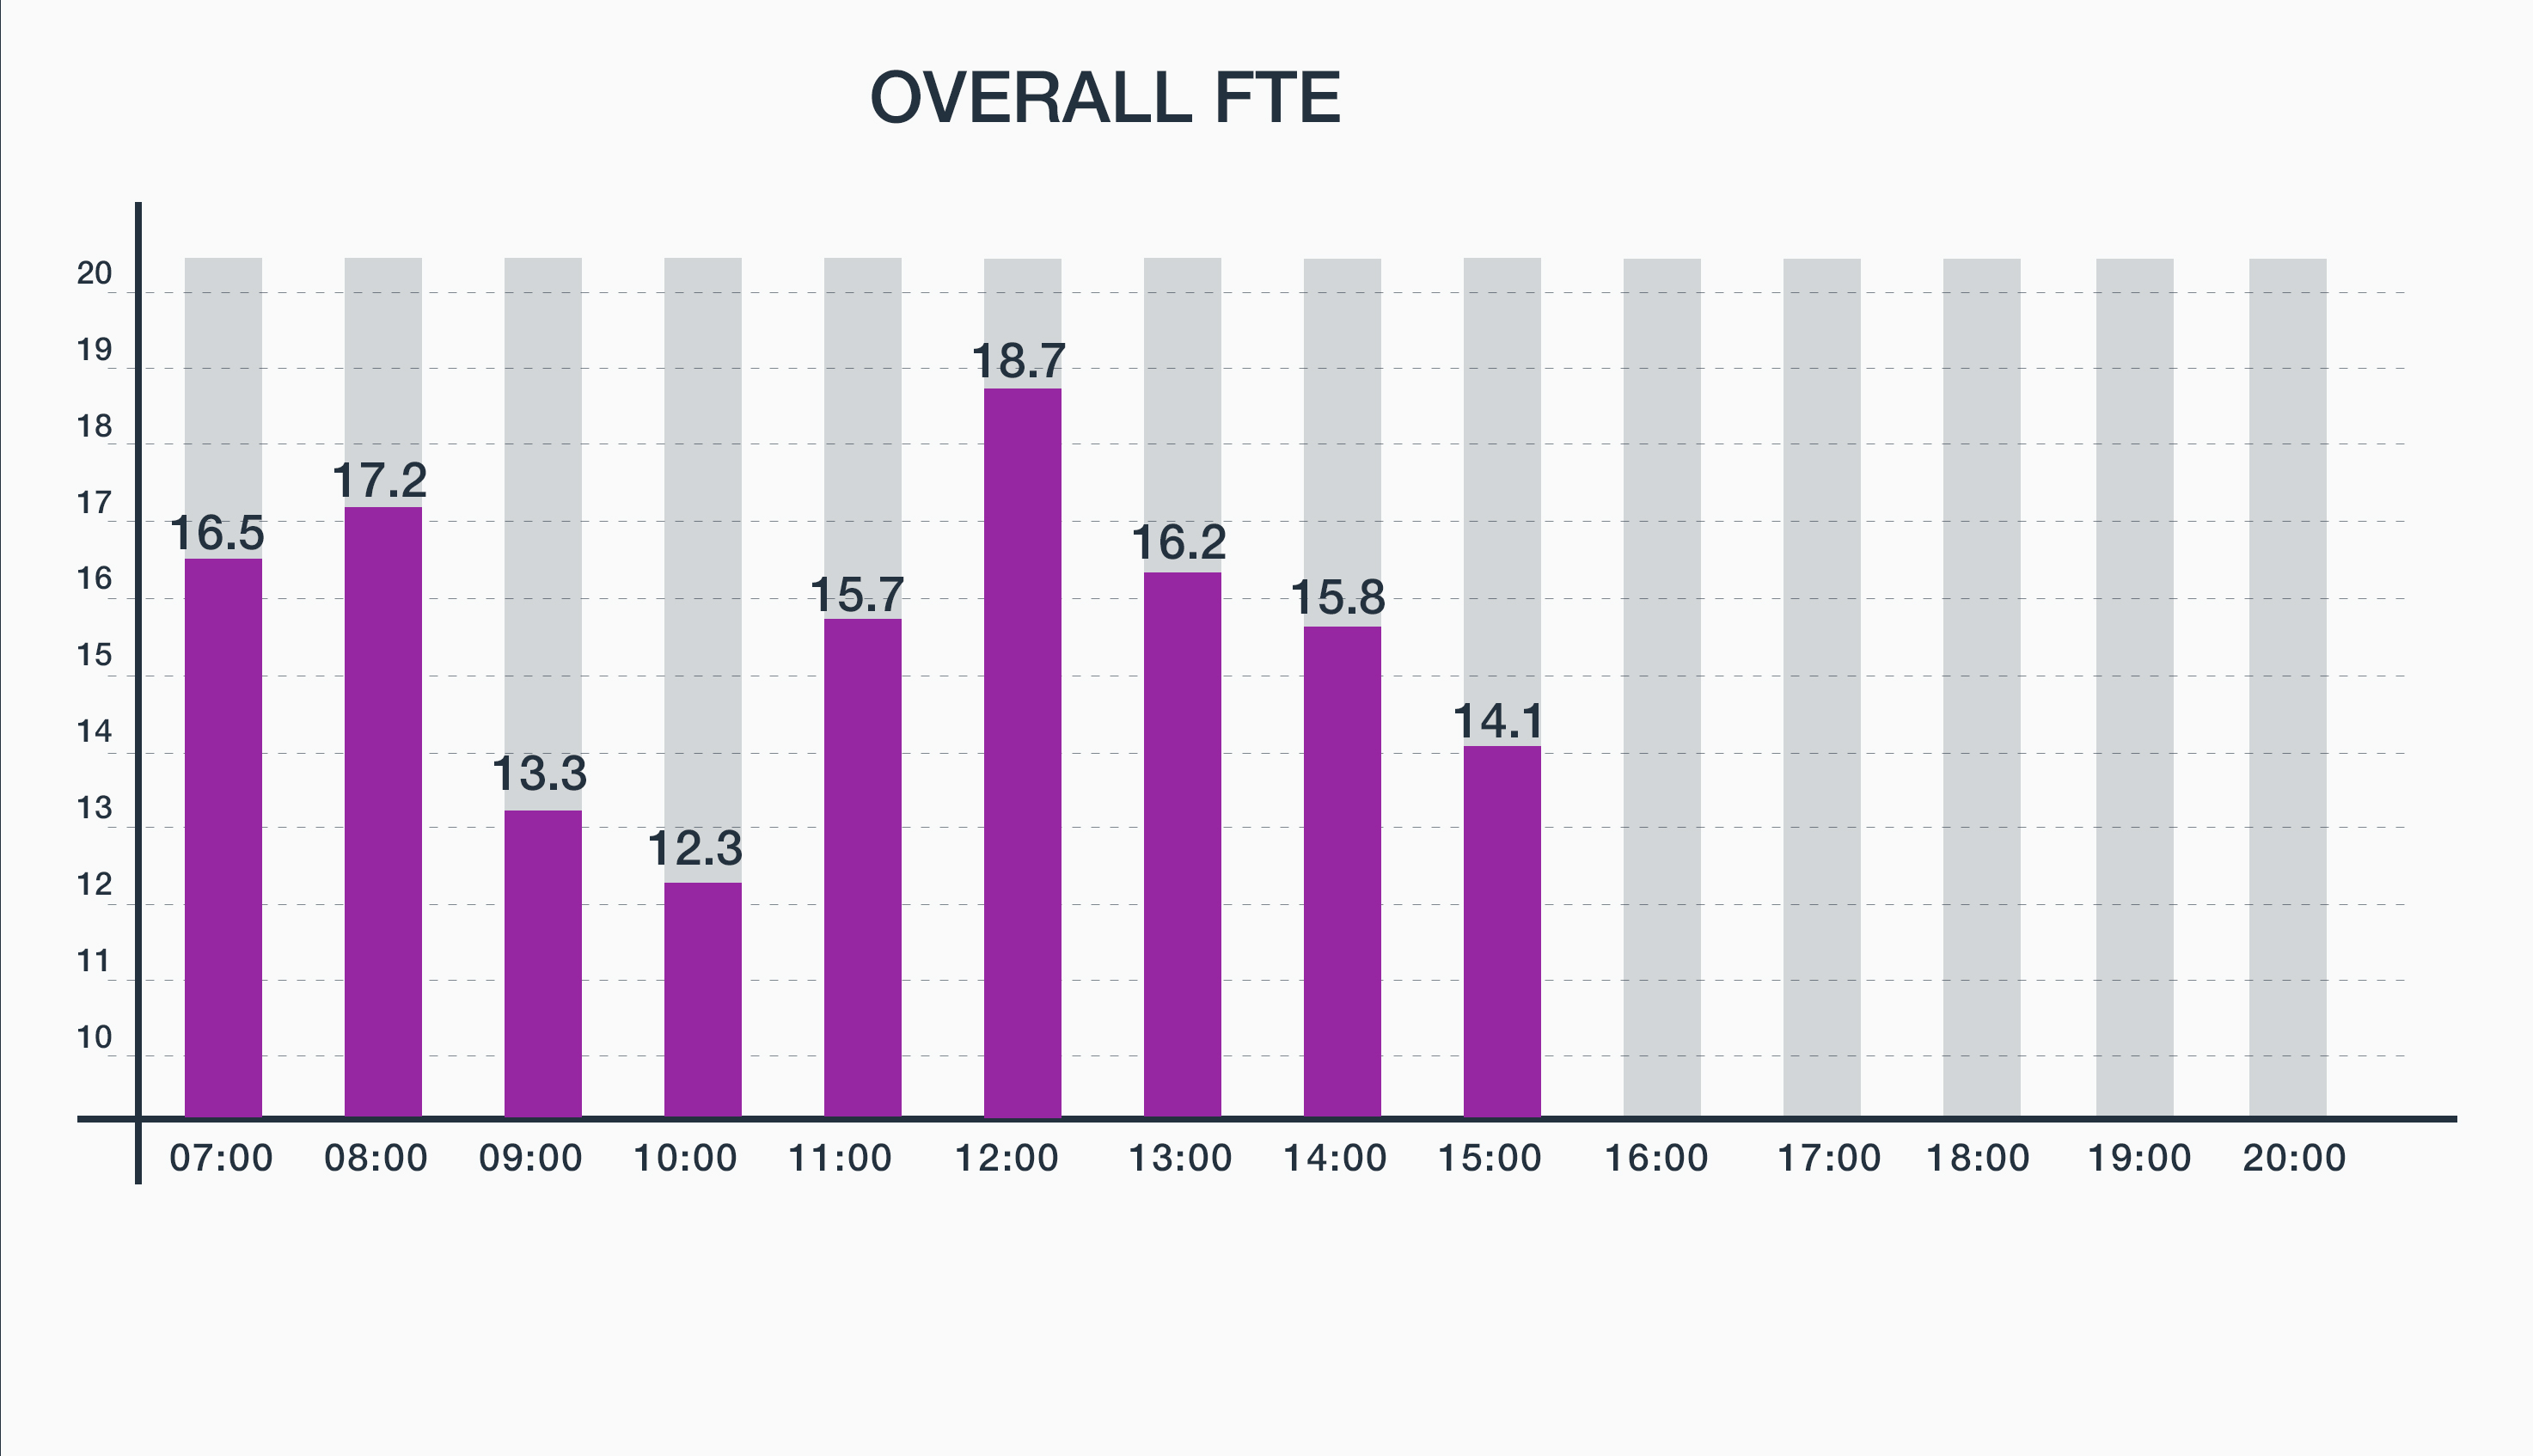
Hourly Full-Time Employee (FTE)
![Comstice Wallboard Widgets for Cisco UCCE]()
The number of FTEs based on the login time of the selected agents on each hour. If an agent was logged in for 60mins on that hour, she is counted as 1 FTE. If an agent is logged in for 45mins, she is counted as 0.75 FTE.
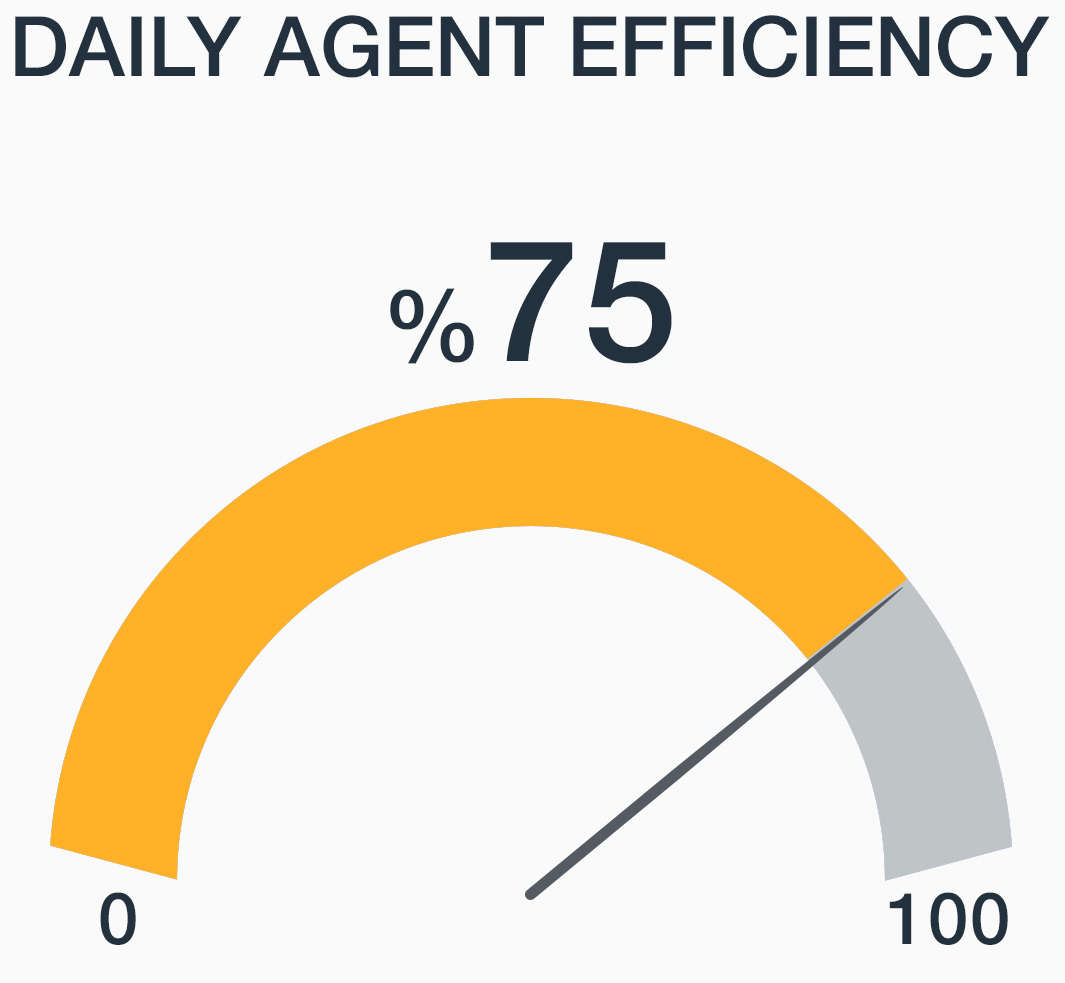
Overall Agent Efficiency
![Comstice Wallboard Widgets for Cisco UCCE]()
Percentage of the time selected agents spent efficiently during their loggedin time. Efficiency is based on the criteria configured by the team leaders and assigned to each team.
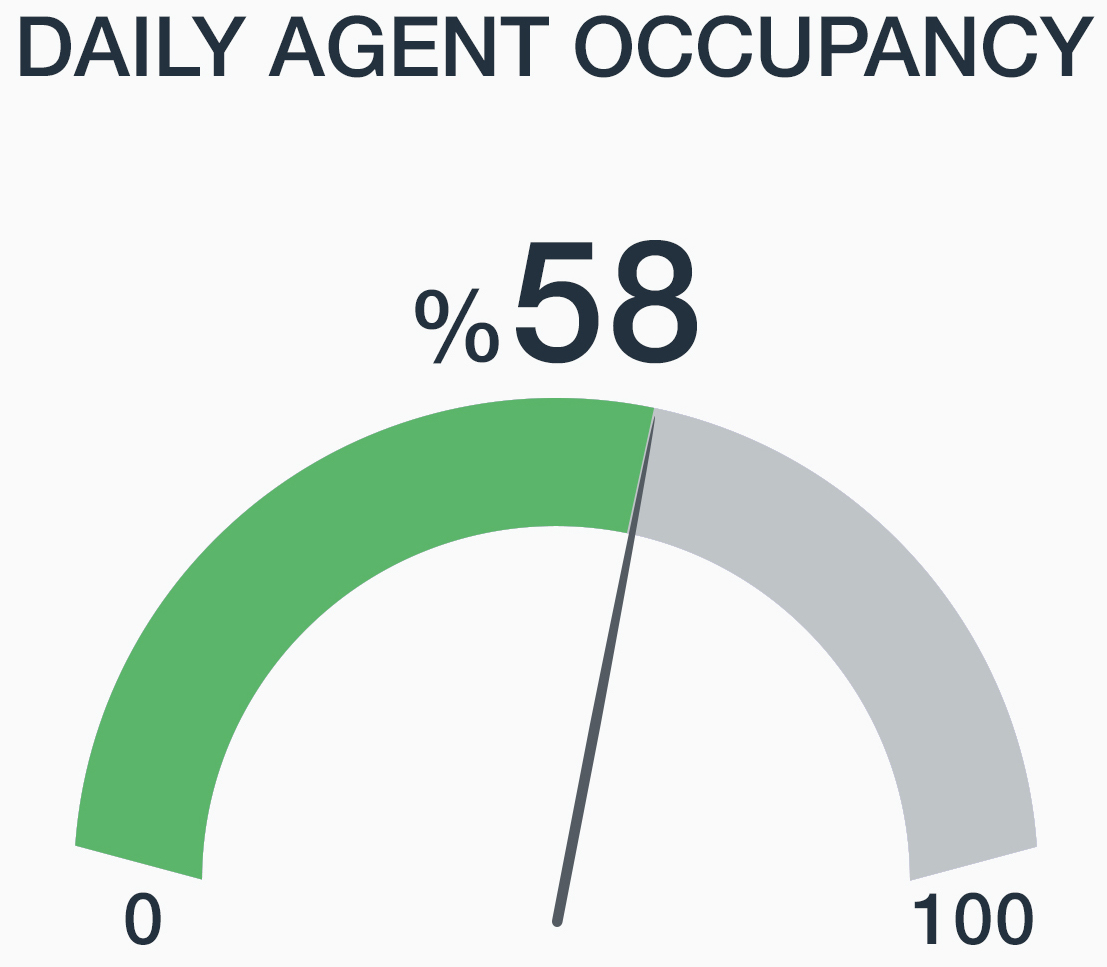
Overall Agent Occupancy
![Comstice Wallboard Widgets for Cisco UCCE]()
Percentage of the time selected agents spent as occupant during their loggedin time. Occupancy is based on the criteria configured by the team leaders and assigned to each team.
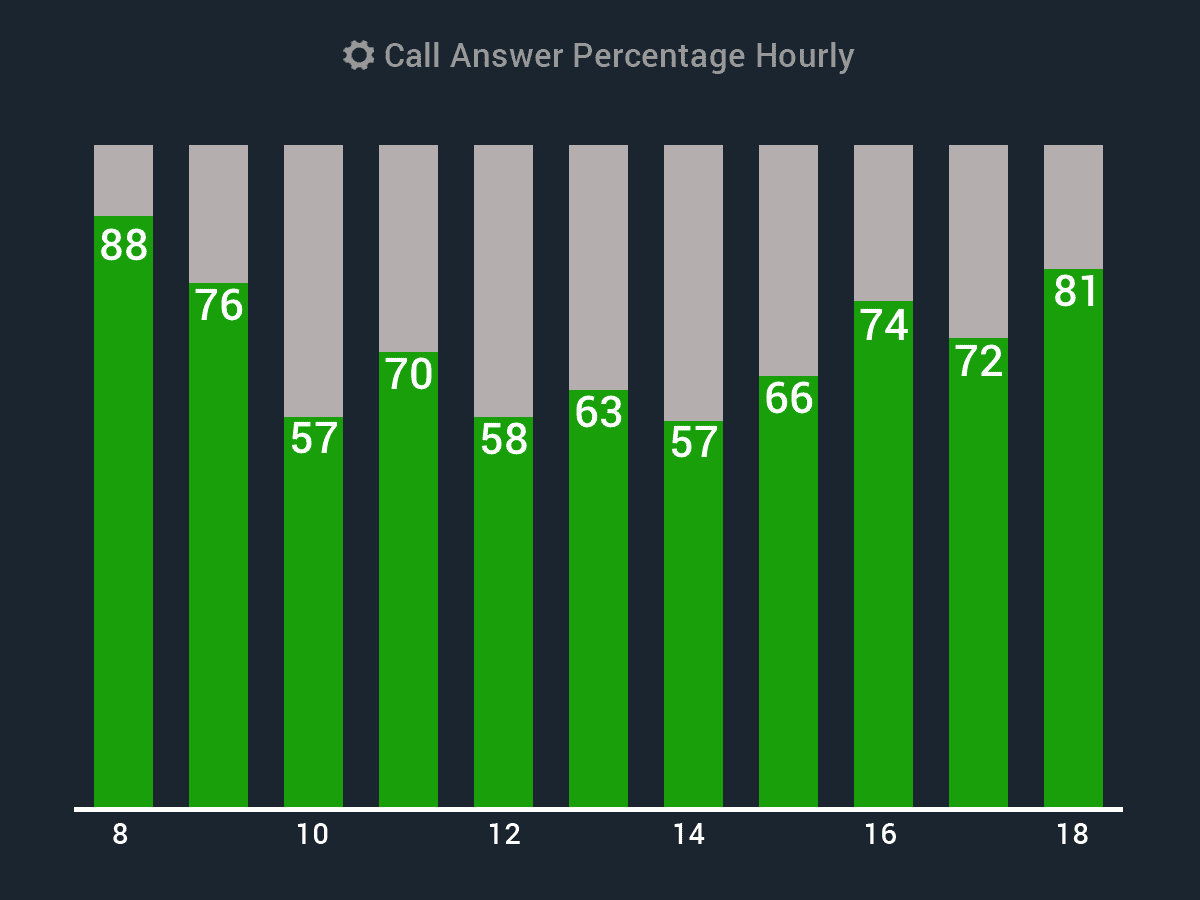
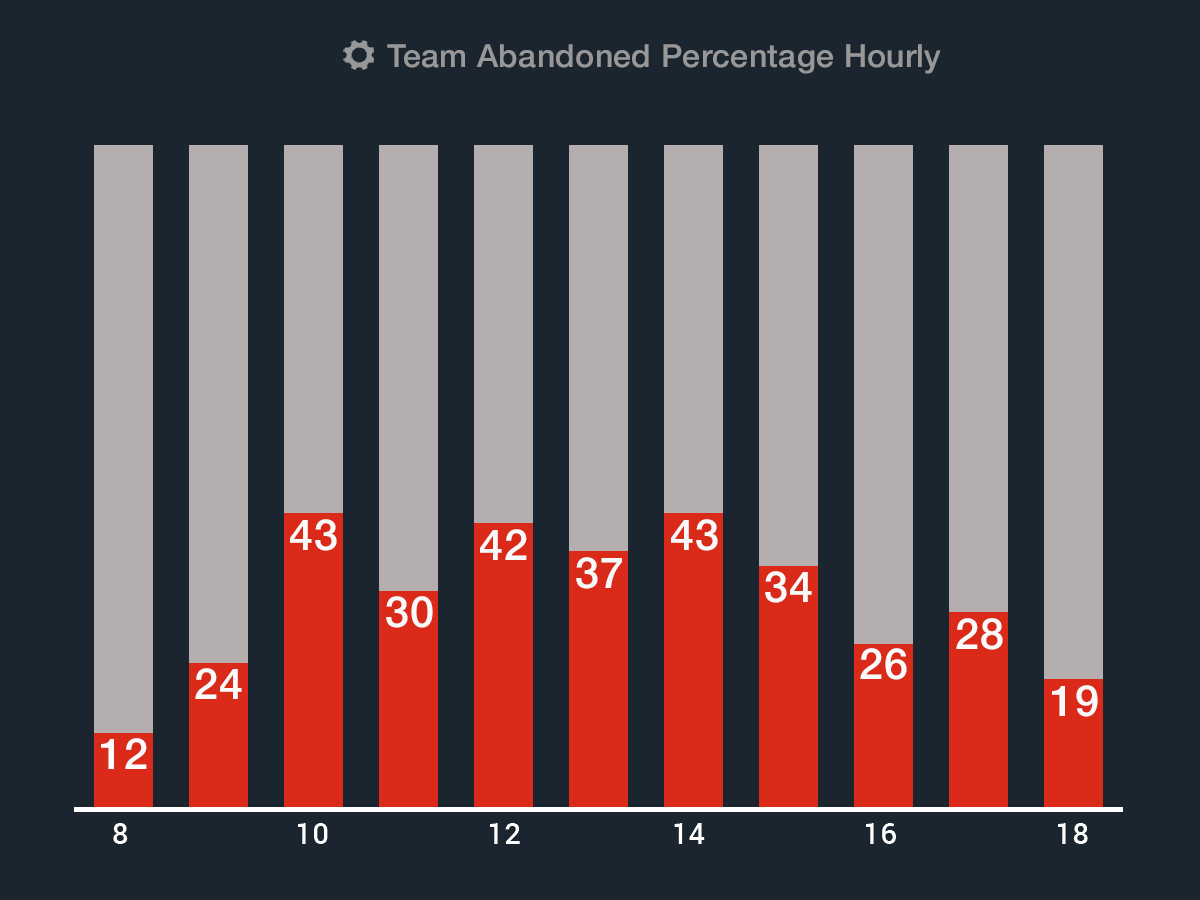
Team Answered % Hourly
![Comstice Wallboard Widgets for Cisco UCCE]()
This shows the percentage of answered calls by the selected agents for each hour with respect to the calls presented to the agent. Reverse of this is therate of RONA calls
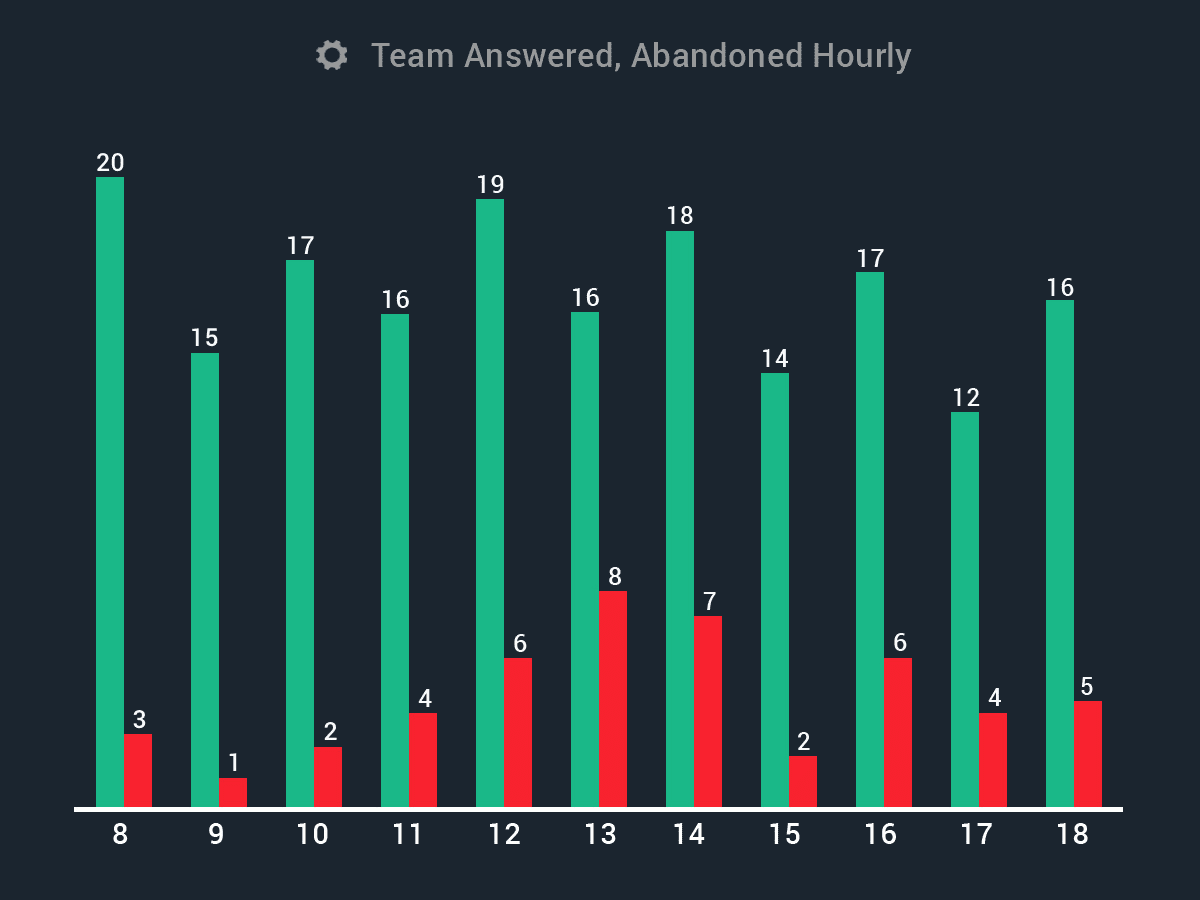
Team Answered Abandoned Hourly
![Comstice Wallboard Widgets for Cisco UCCE]()
This widget shows the answered and RONA call count per hour for the agents selected.
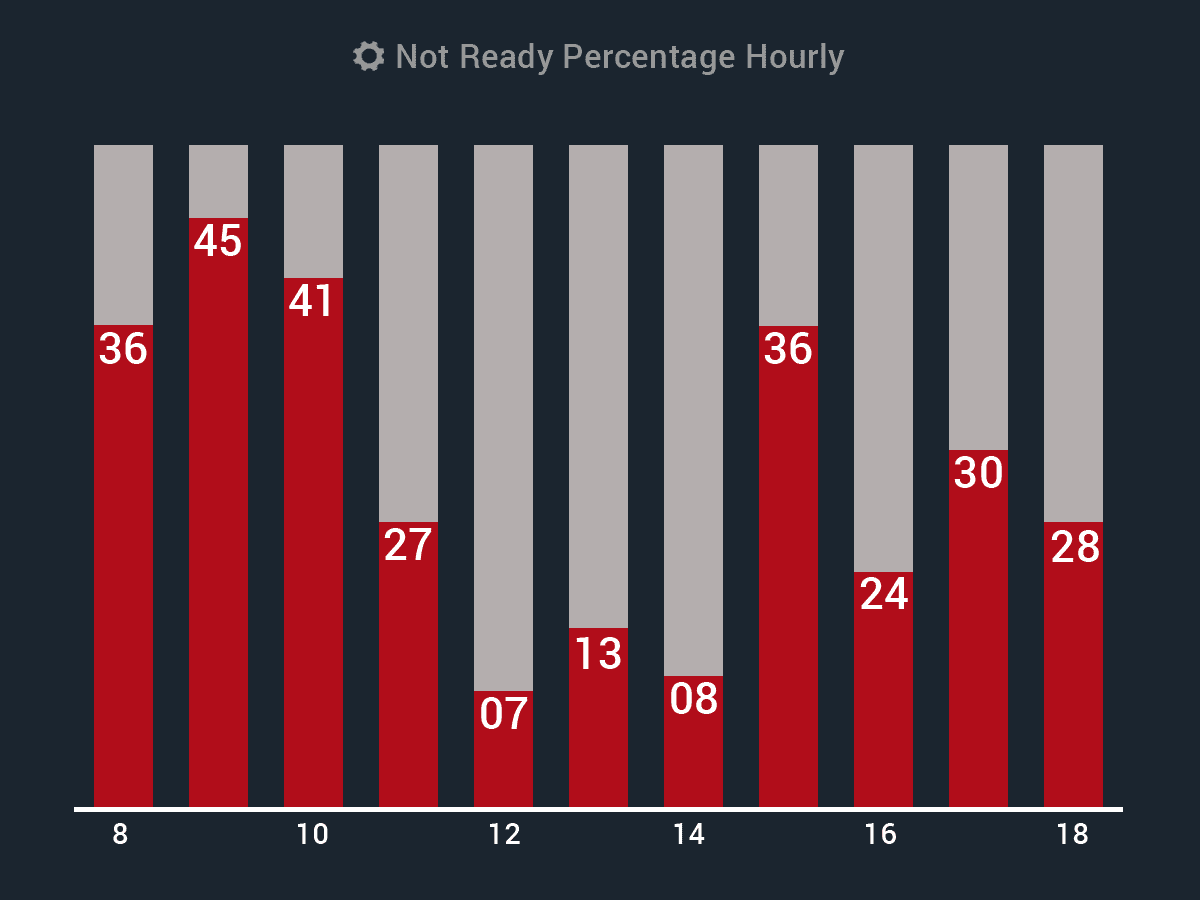
Team Not Ready Percentage Hourly
![Comstice Wallboard Widgets for Cisco UCCE]()
This widget shows the average not ready percentage of the selected agents at each hour based on the time they were logged in.
Team RONA % Hourly
![Comstice Wallboard Widgets for Cisco UCCE]()
Number of Reroute On No Answer calls by the selected agents per hour
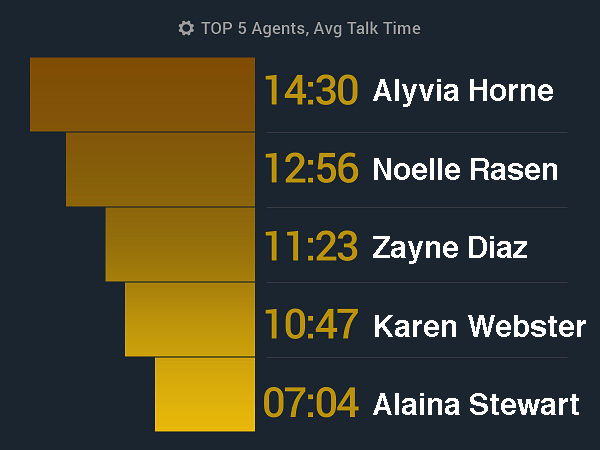
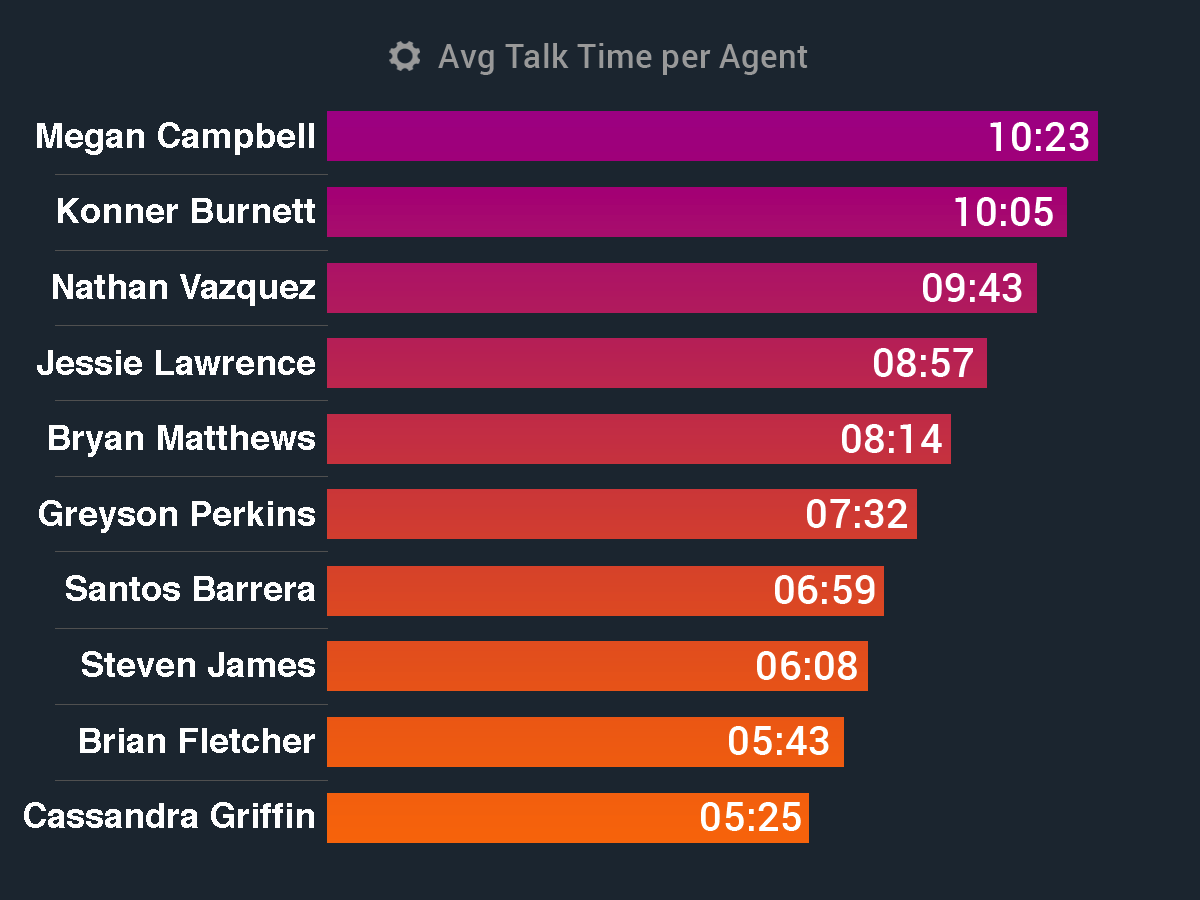
Top 5 10 Agents Average Talk Time
![Top5 Agents Rona Calls]()
This widget lists the top 5 10 agents from the selected agent list by average talk time on that day.
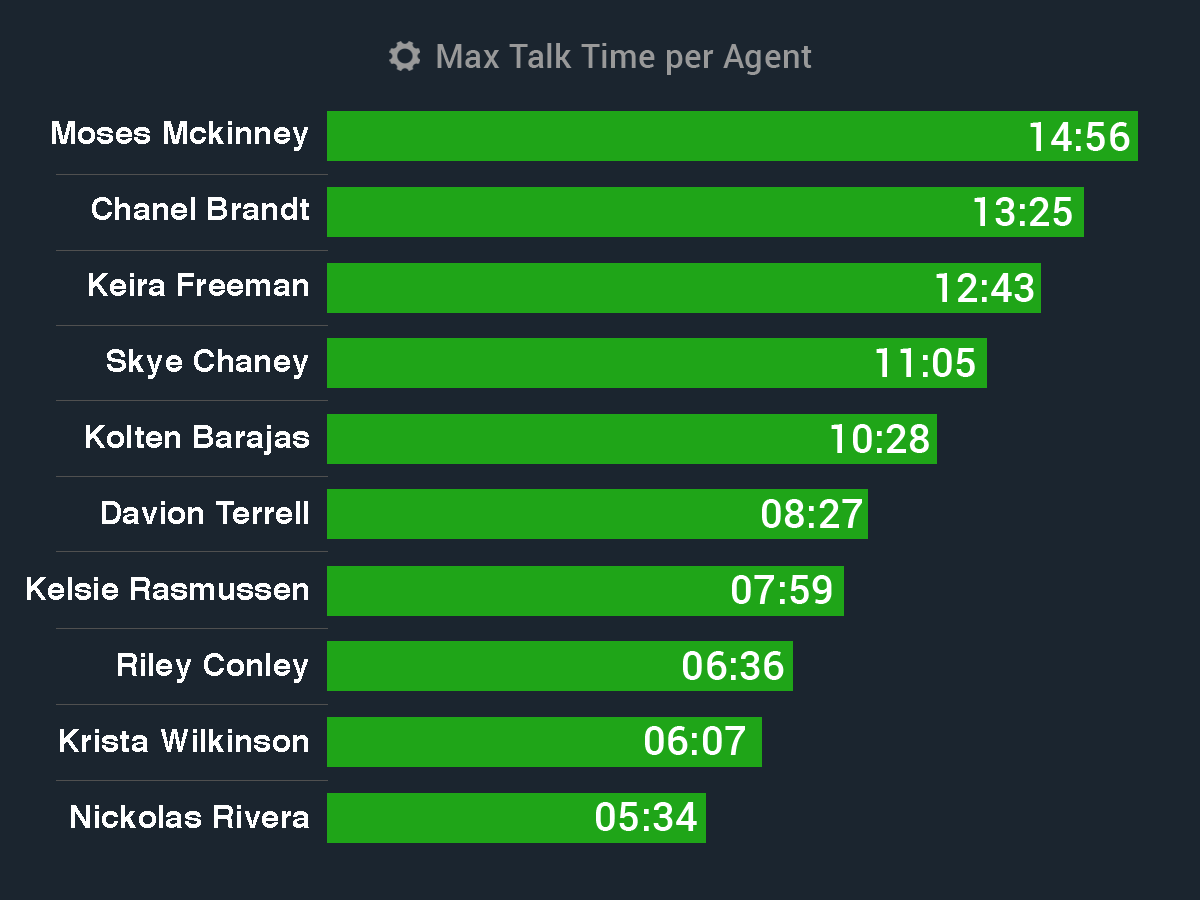
Top 5 10 Agents with Longest Calls
![Comstice Wallboard Widgets for Cisco UCCE]()
This widget lists the top 5 or 10 agents from the selected list who had the longest handle time with an inbound customer.
Top 5 10 Avg Handle Time Agents
![Comstice Wallboard Widgets for Cisco UCCE]()
This widget lists the top agents from the selected agents based on their average handle time on that day.
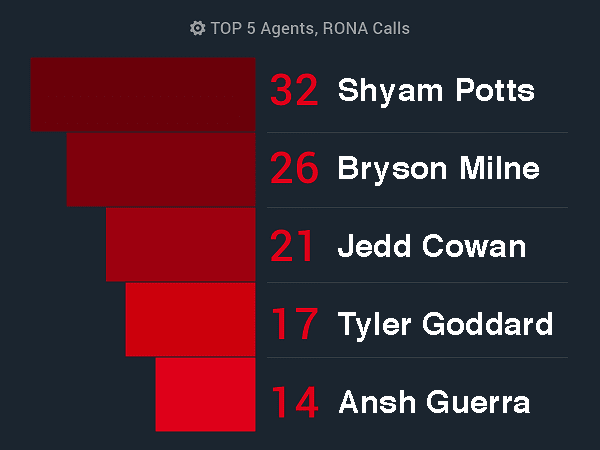
Top 5 or 10 Agents, RONA Calls
![Top5 Agents Rona Calls]()
RONA is the call which arrived on agent's phone, rang for a while but has not been answered by the agent. The call then gets sent back to the queue. It is an unwanted situation hence needs to be monitored. This widget shows the top 5 or 10 agents in your selected agent list who had the highest number of RONA calls.
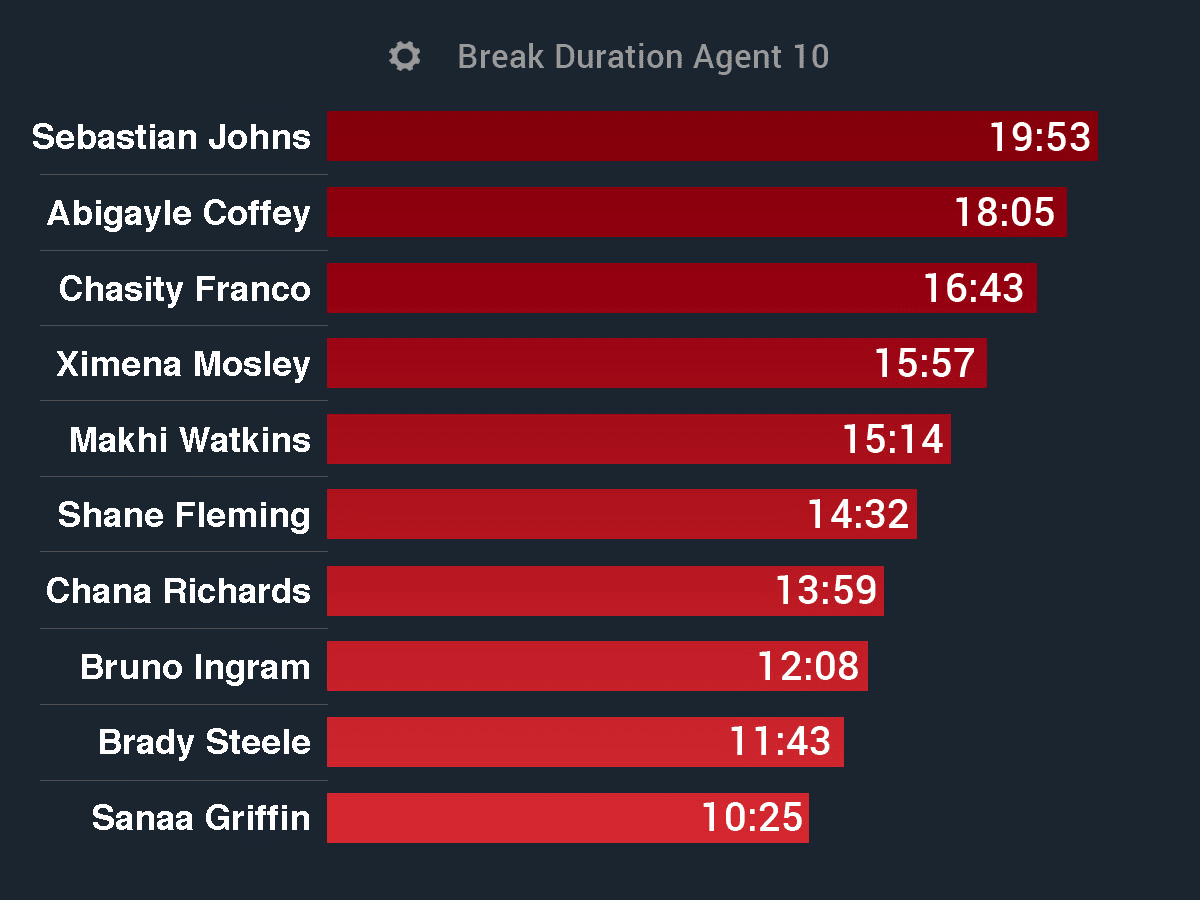
Top 5, 10 agents Break Duration
![Comstice Wallboard Widgets for Cisco UCCE]()
Certain reason codes are considered as "Break" such as lunch, toilet break, 15-min off etc. This widget helps team leaders to monitor and manage agent break durations.
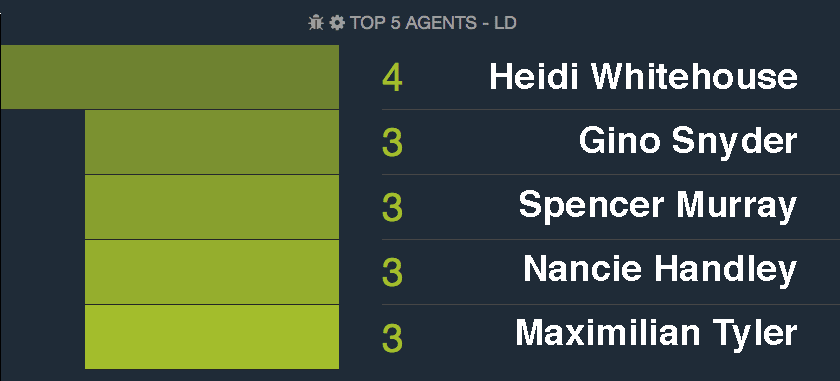
Top 5, 10 Agents
![Comstice Wallboard Widgets for Cisco UCCE]()
This widget shows the top 5 or 10 agents from the selected agents list based on the number of calls answered.
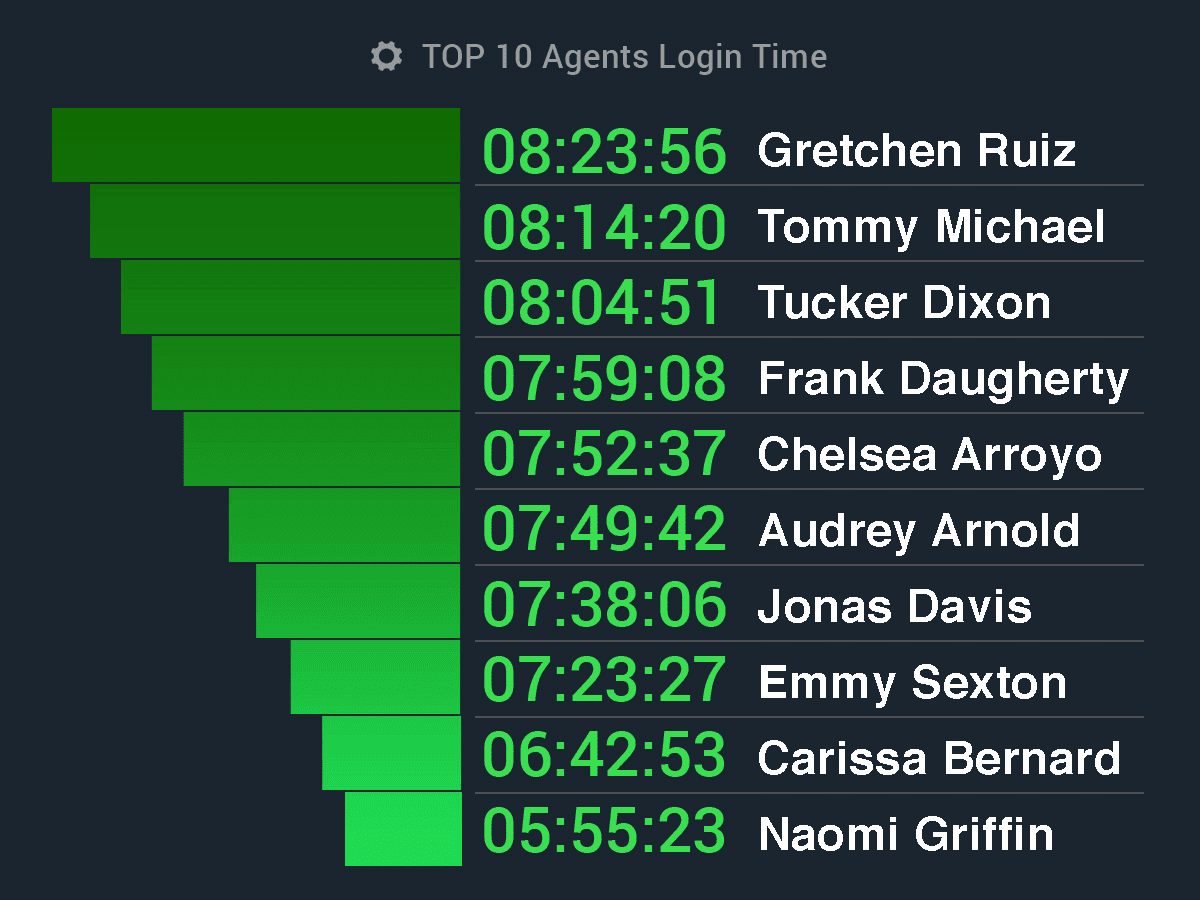
Top 5, 10, 20 Agents Login Time
![Comstice Wallboard Widgets for Cisco UCCE]()
This widget lists the top agents based on their total login time during the day.
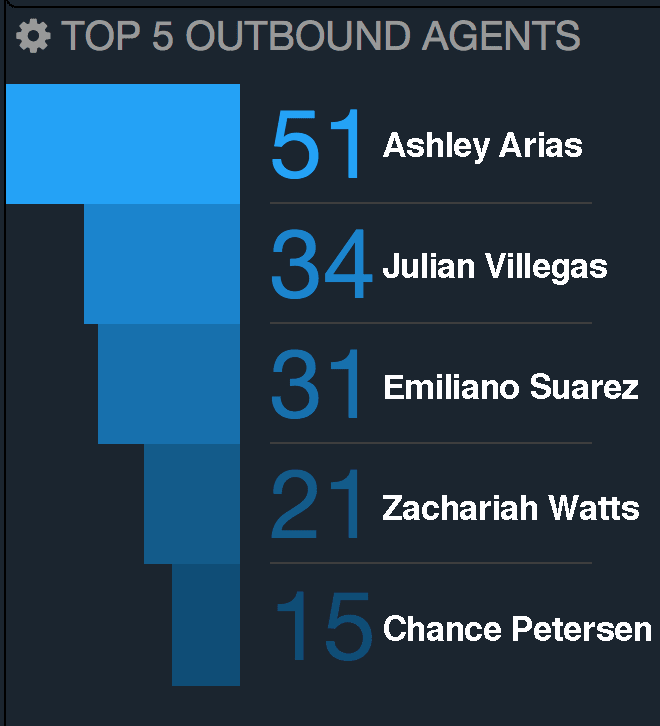
Top 5, 10, 20 Agents Outbound Calls
![Comstice Wallboard Widgets for Cisco UCCE]()
This widget lists the top agents who managed to answer the most outbound dialer calls.
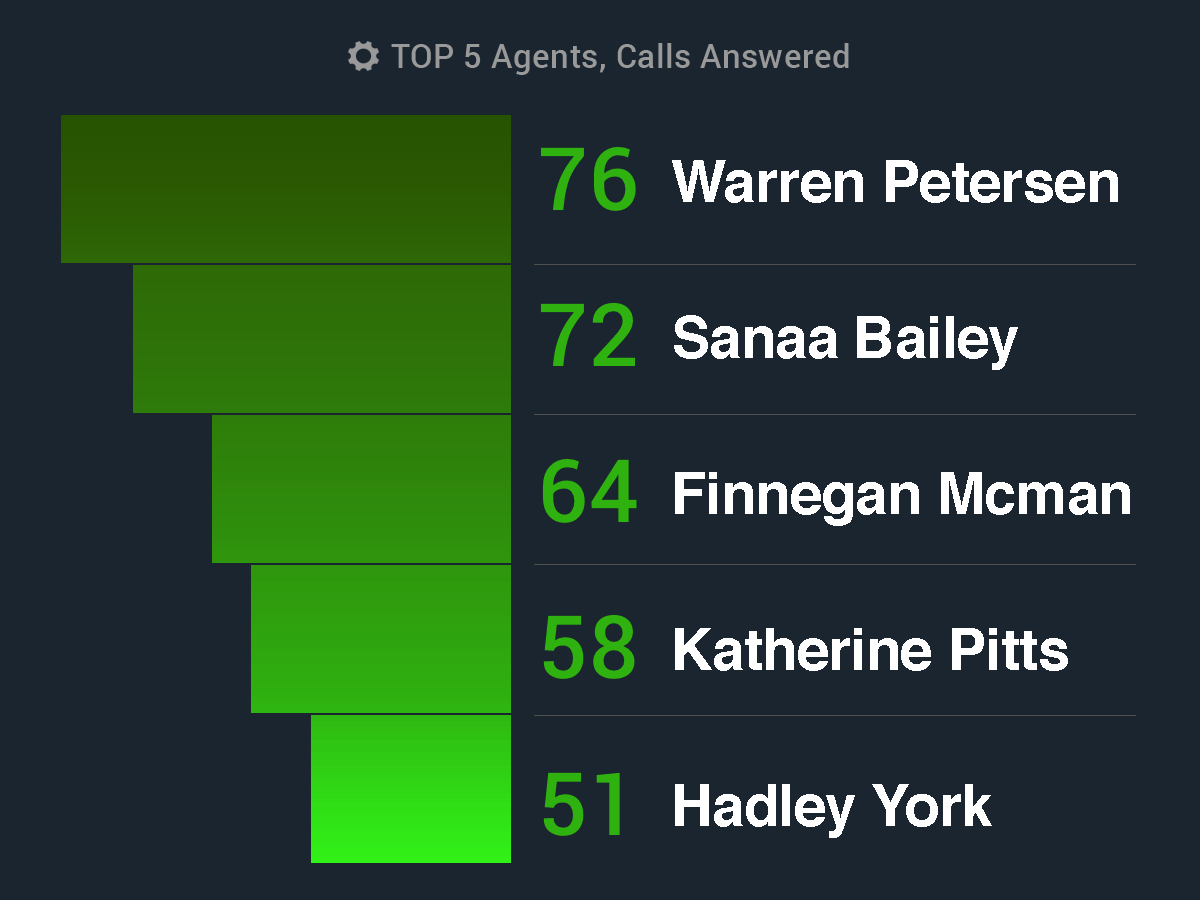
Top 5, 10, 20 Agents, Calls Answered
![Comstice Wallboard Widgets for Cisco UCCE]()
This widget lists the top agents who managed to answer the most inbound customer calls.
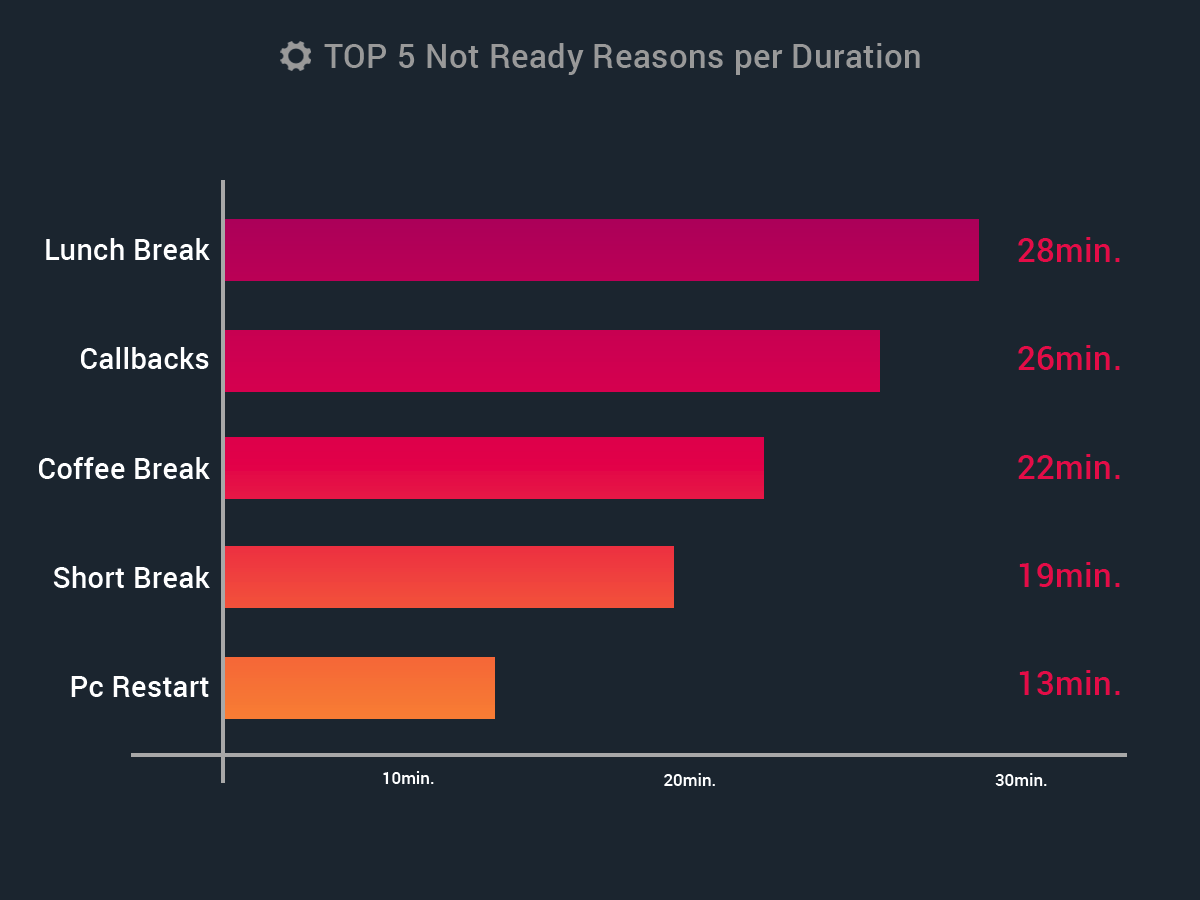
Top 5-10 Not Ready Reasons per duration
![Comstice Wallboard Widgets for Cisco UCCE]()
This widget lists the top 5 or 10 reason codes based on the duration for the selected agents.
-
Call Type
Call Type
Call Type widgets show the respective call volumes, service levels, handle and wait times for the incoming calls.
Call Types are also used for marking certain call state our route in the reports. Hence, some of the call types may have many calls offered but no calls answered or abandoned. We can these call types as transient. In the call type widget settings, you can tick the box "Exclude calltypes with zero answered and abandoned" which will ignore the transient call types in the widget.
Hourly charts show the full 24 hr window by default. It is also possible to set the start and end time so that x-axis of the chart will only cover the working hours of your team.
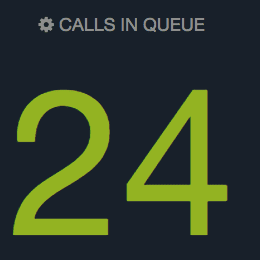
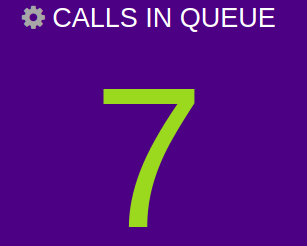
Calls in Queue
![Comstice Wallboard Widgets for Cisco UCCE]()
This widget displays the total number of calls waiting in the queues selected in the widget settings. If the thresholds are set, the background will be color-coded with amber / threshold 1 and red / threeshold 2. It is also possible to enable audio alerts as well.
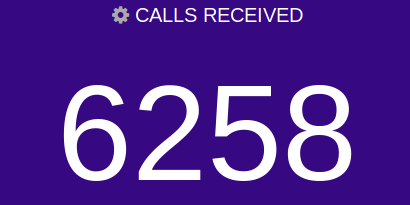
Calls Received
![Comstice Wallboard Widgets for Cisco UCCE]()
This is the number of calls offered for the selected call types on that day, starting from midnight of the day.
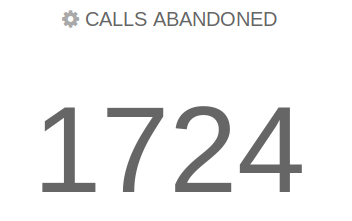
Calls Abandoned
![Comstice Wallboard Widgets for Cisco UCCE]()
This is the number of calls abandoned by the caller while waiting in the queue for the selected call types on that day, starting from midnight of the day.
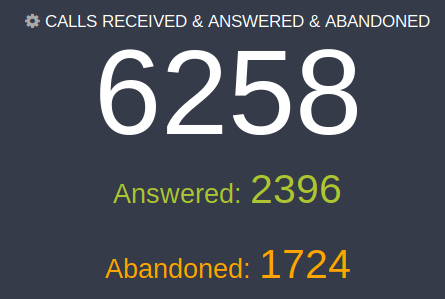
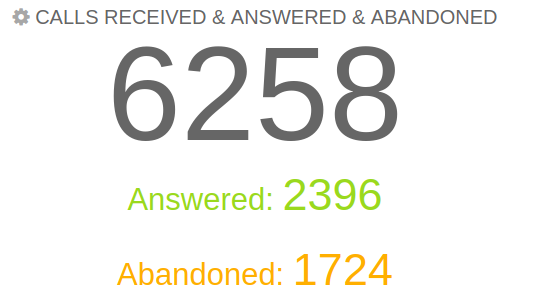
Calls Received, Answered and Abandoned
![Comstice Wallboard Widgets for Cisco UCCE]()
Total number of calls received or offered, answered (may not be yet handled) and abandoned during the day.
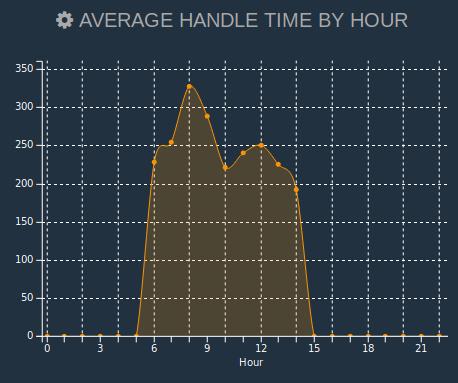
Avg Handle Time Hourly
![Comstice Wallboard Widgets for Cisco UCCE]()
Average Handle Time is the average of the handle times for each call types combined for that day. We find the weighted average of the selected call types by using total calls handled value as the weight.
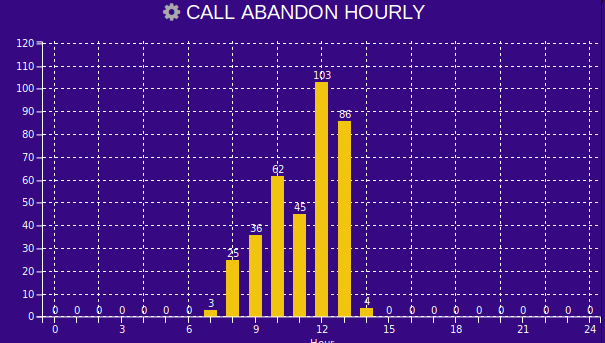
Calls Abandoned Hourly
![Comstice Wallboard Widgets for Cisco UCCE]()
Total calls abandoned at each hour for every call type selected in the widget settings for that day.
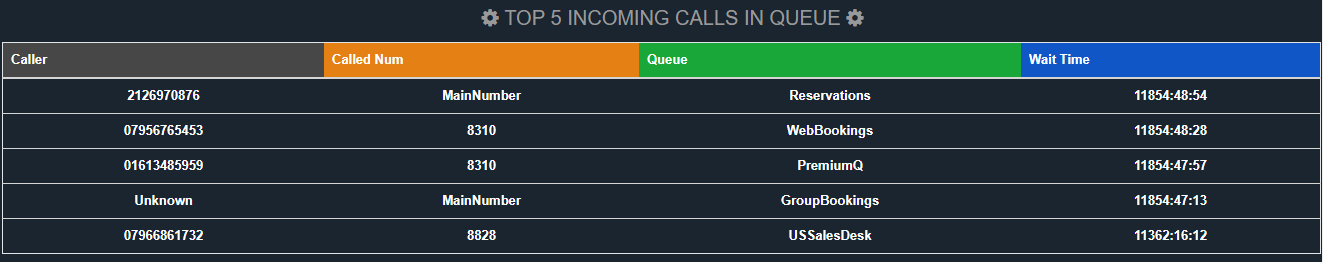
Top 5, 10 Calltypes Calls in Queue
![Comstice Wallboard Widgets for Cisco UCCE]()
Individual calls waiting in the queue. This feature requires Comstice CTI Service. Please consult your Comstice account manager about this feature.
Calls Other
![Comstice Wallboard Widgets for Cisco UCCE]()
Calls which are offered but not answered or abandoned. They are usually dequeued calls, short calls, failed calls. There is a long list of call classification in Cisco UCCE reports and the database schema. You can verify those from Cisco documentation.
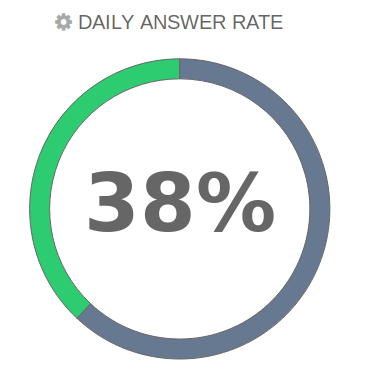
Daily Answer Rate
![Comstice Wallboard Widgets for Cisco UCCE]()
Percentage of calls answered versus the calls offered. It is also possible to exclude certain call classifications such as short calls, redirected/dequeued calls etc. to increase the answer rate.
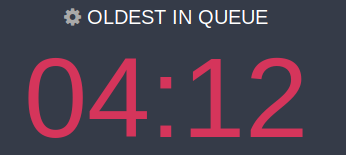
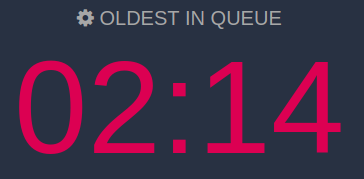
Oldest in Queue
![Comstice Wallboard Widgets for Cisco UCCE]()
Duration of the longest waiting call within the group of call types selected in the settings.
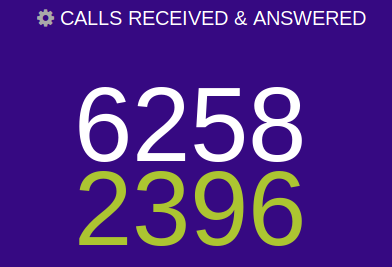
Calls Received and Answered
![Comstice Wallboard Widgets for Cisco UCCE]()
Total number of calls offered and answered. It is also possible to exclude certain call classifications such as short calls, redirected/dequeued calls etc. to minimize the calls offered value.
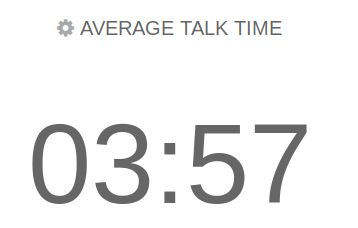
Avg Talk Time
![Comstice Wallboard Widgets for Cisco UCCE]()
Average talk time for each call type. We use the calls handled as the weight and calculate the weighted average.
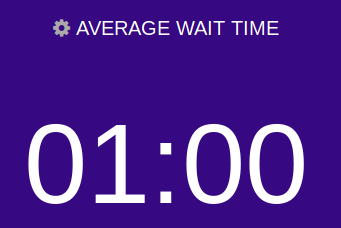
Avg Wait Time
![Comstice Wallboard Widgets for Cisco UCCE]()
Average wait time for each call type. We use the calls handled as the weight and calculate the weighted average.
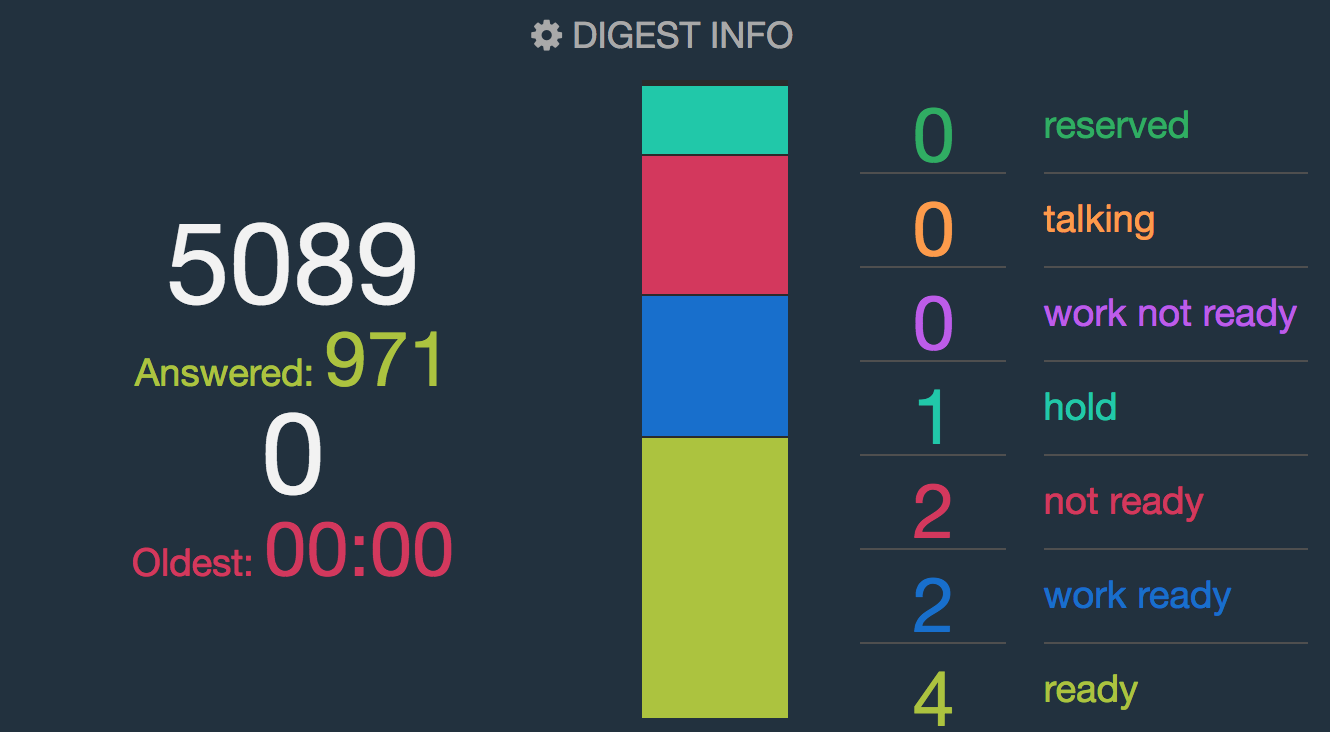
Digest Info
![Comstice Wallboard Widgets for Cisco UCCE]()
This widget is a combination of agent state distribution as well as the call type calls in queue, oldest in queue, calls offered, answered and abandoned.
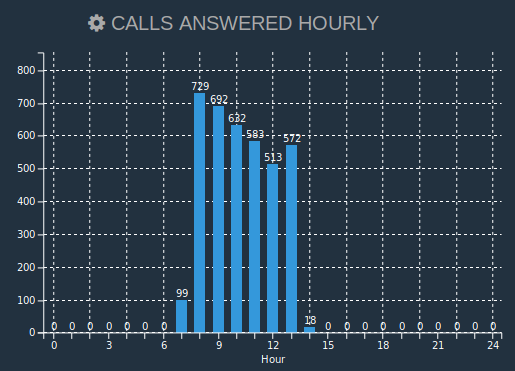
Calls Answered Hourly
![Comstice Wallboard Widgets for Cisco UCCE]()
Total number of calls answered each hour for the selected call types.
Calls Abandoned Hourly
![Comstice Wallboard Widgets for Cisco UCCE]()
Total number of calls abandoned each hour for the selected call types.
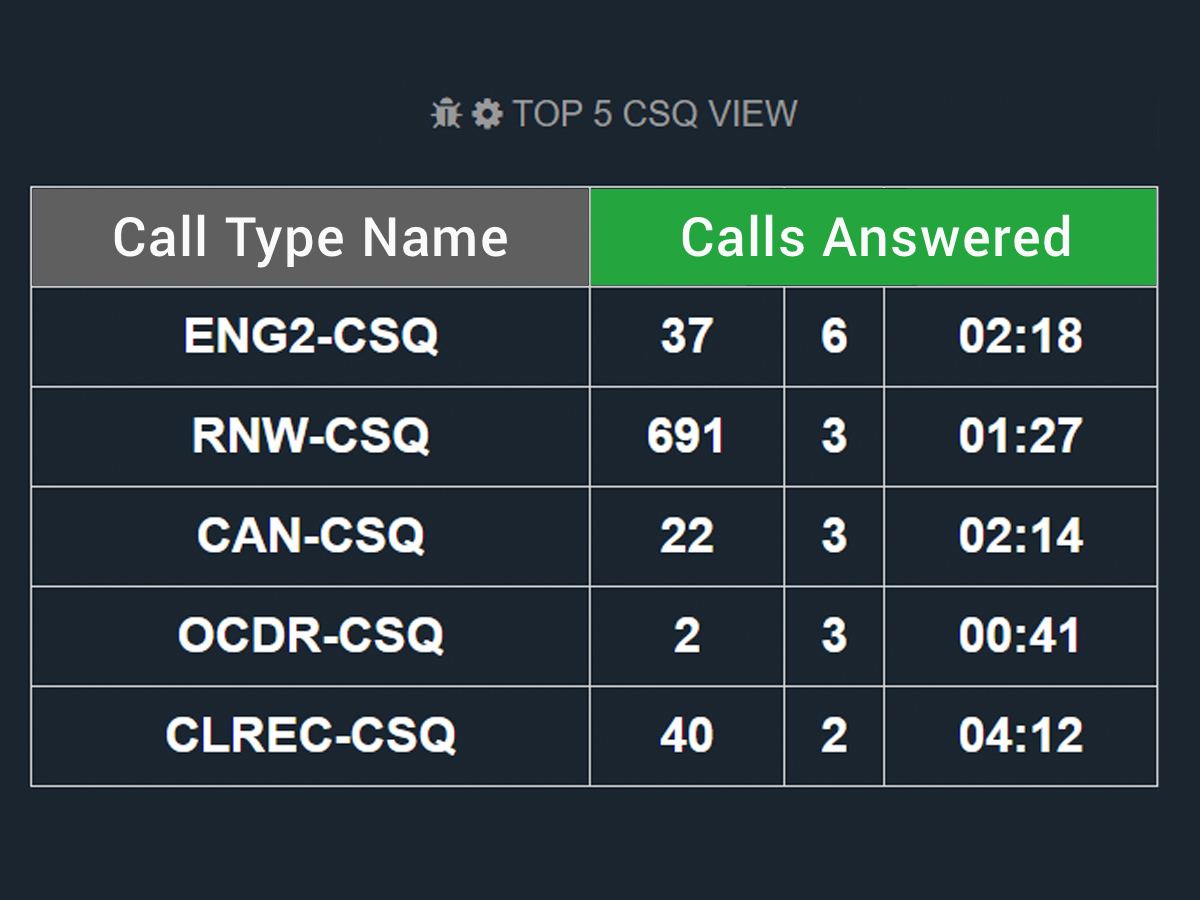
Top 5, 10 Calls Answered per Calltype
![Comstice Wallboard Widgets for Cisco UCCE]()
This widget lists the top call types with the higest number of answered calls.
Calls Received, Answered, Abandoned per Calltype
![Comstice Wallboard Widgets for Cisco UCCE]()
Total calls offered, answered and abandoned per Call Type
Top 5,10 Call Types
![Comstice Wallboard Widgets for Cisco UCCE]()
This table dynamically displays the call types with calls waiting from the list of selected call types. If there are no calls in the queue for those call types, it lists the call types with the highest number of received calls.
Calls Other Hourly
![Comstice Wallboard Widgets for Cisco UCCE]()
This widget lists the number of received calls other than answered or abandoned in an hourly chart. This can be used to identify spikes in error calls or to monitor overflow calls.
Top 5,10 Calltypes Calls Abandoned
![Comstice Wallboard Widgets for Cisco UCCE]()
This widget shows the calltypes with the highest number of abandoned calls, top 5 or 10 from the selected calltypes.
Service Level Percent Hourly
![Comstice Wallboard Widgets for Cisco UCCE]()
Service level answered percentage at each hour for the selected calltypes.
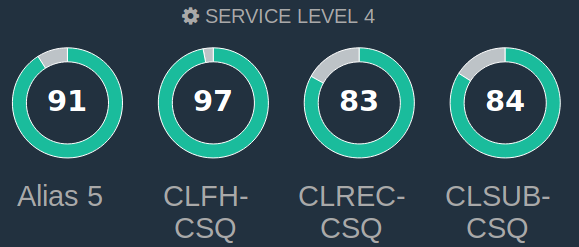
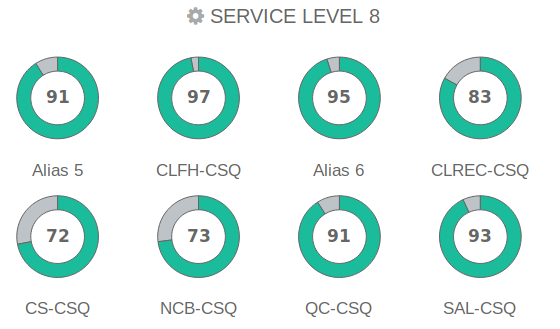
Service Level 4,8 Donut
![Comstice Wallboard Widgets for Cisco UCCE]()
Service level answered percentage for the individual calltypes for that day starting from midnight. It may show 4 or 8 donut charts, one for each calltype.
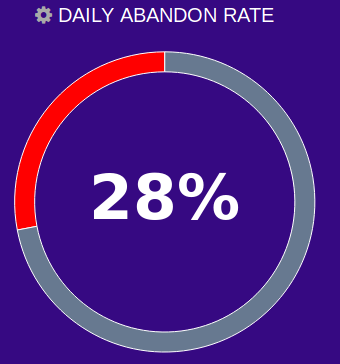
Daily Abandon Rate
![Comstice Wallboard Widgets for Cisco UCCE]()
Percentage of abandoned calls for the selected calltypes with respect to calls offered. User can also select the option to ignore the calltypes with zero answered and abandoned calls, i.e. transient calltypes.
-
Skill Group
Skill Group
Here is a list of widgets for Cisco UCCE Skill Groups which can be used in Comstice Wallboard.
Calls in Queue
![Comstice Wallboard Widgets for Cisco UCCE]()
Total number of calls in queue for the selected skill groups.
Oldest in Queue
![Comstice Wallboard Widgets for Cisco UCCE]()
Duration of the longest waiting call in queue in queue for the selected skill groups.
Grouped Skills
![Comstice Wallboard Widgets for Cisco UCCE]()
This widget helps user to group the skill groups into single row and create a table with multiple grouped SGs.
Grouped Skills Digest
![Comstice Wallboard Widgets for Cisco UCCE]()
This widget helps user to group the skill groups into single row and create a table with multiple grouped SGs.
Received, Answered, Abandoned
![Comstice Wallboard Widgets for Cisco UCCE]()
This widget shows the total number of received, answered and abandoned calls for the selected skill groups.
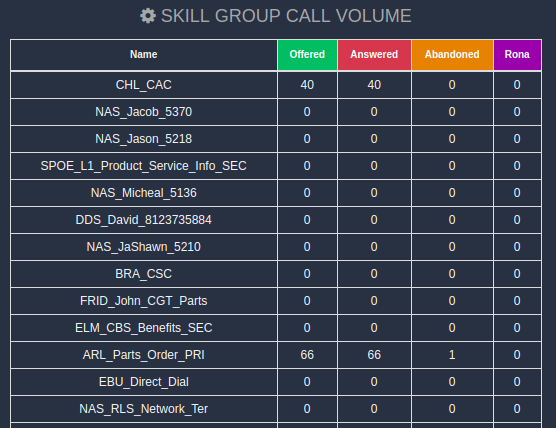
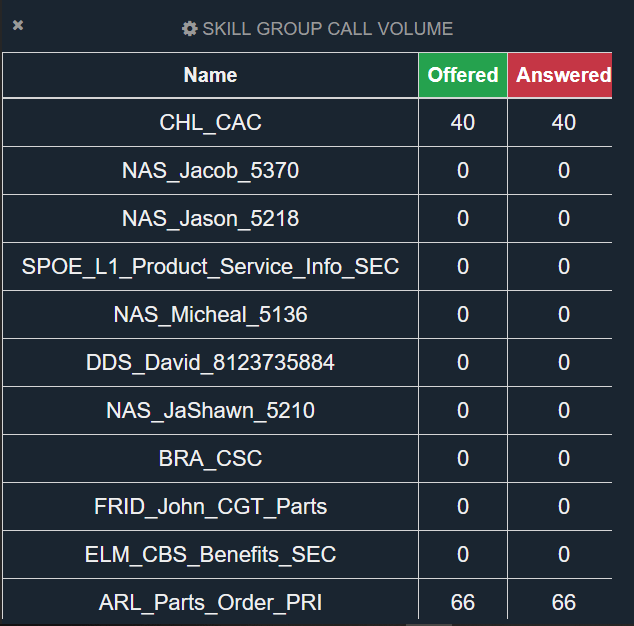
Skill Group Call Volume
![Comstice Wallboard Widgets for Cisco UCCE]()
This widget shows the offered, answered, abandoned and RONA (re-route on no answer) calls for the selected skill groups.
Skill Group Hourly
![Comstice Wallboard Widgets for Cisco UCCE]()
This chart shows the offered, answered and abandoned calls for the selected skill groups for each hour of the day.
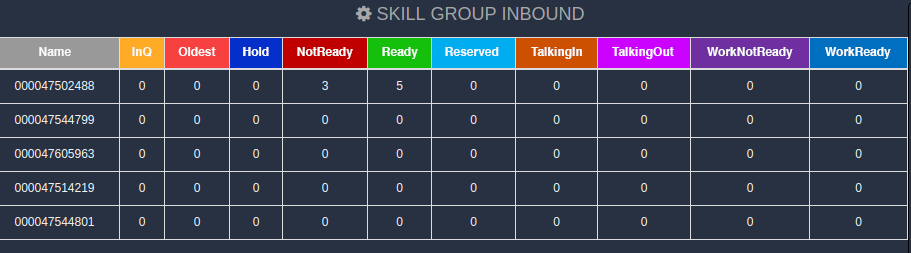
Skill Group Inbound
![Comstice Wallboard Widgets for Cisco UCCE]()
This widget shows each skill group as a separate row in the table and lists the agent availability and the queue stats real-time.
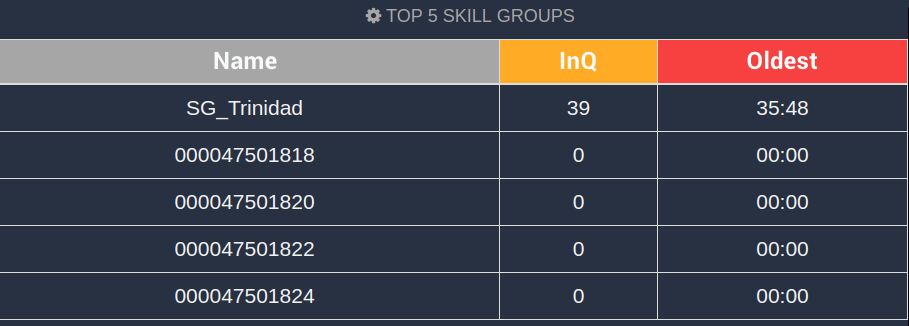
Top 5 Skill Groups (per calls in queue)
![Comstice Wallboard Widgets for Cisco UCCE]()
This chart shows the top 5 or 10 skill groups from the selected skill group list based on the calls waiting in the queue.
PrecisionPrecision
Comstice Wallboard presents real-time and historical data for precision queues.
Calls in Queue
![Comstice Wallboard Widgets for Cisco UCCE]()
Total number of calls waiting in the queue for the selected precision queues.
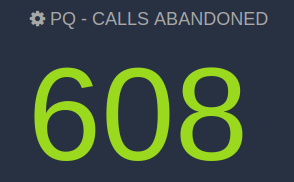
Calls Abandoned
![Comstice Wallboard Widgets for Cisco UCCE]()
Total number of calls abandoned for the selected precision queues.
Calls Received, Answered and Abandoned
![Comstice Wallboard Widgets for Cisco UCCE]()
Total number of calls received, answered and abandoned for the selected precision queues. Received calls may be greater than the sum of answered and abandoned calls since some calls can be dequeued and redirected to other labels.
Avg Talk Time
![Comstice Wallboard Widgets for Cisco UCCE]()
Average talk time for the selected precision queues. This value is calculated using weighted averaging with calls handled.
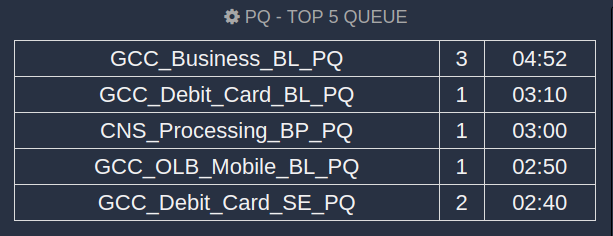
Top 5,10 PQ Calls in Queue
![Comstice Wallboard Widgets for Cisco UCCE]()
Based on the selected precision queues, this table shows the top 5 or 10 precision queues with the highest number of calls waiting.
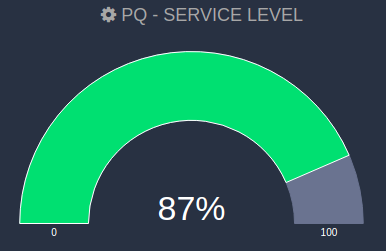
Service Level (Gauge, Value)
![Comstice Wallboard Widgets for Cisco UCCE]()
Service level answered for the selected precision queues.
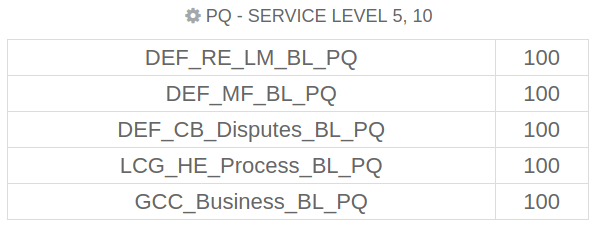
Service Level 5, 10
![Comstice Wallboard Widgets for Cisco UCCE]()
Top 5, 10 precision queues with service level answered for the selected precision queues.
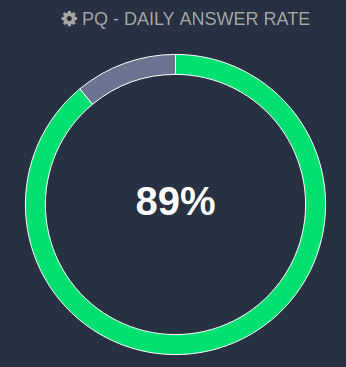
Daily Answer Rate
![Comstice Wallboard Widgets for Cisco UCCE]()
Precentage of calls answered versus the calls received.
Oldest in Queue
![Comstice Wallboard Widgets for Cisco UCCE]()
Duration of the longest waiting call in the selected precision queues.
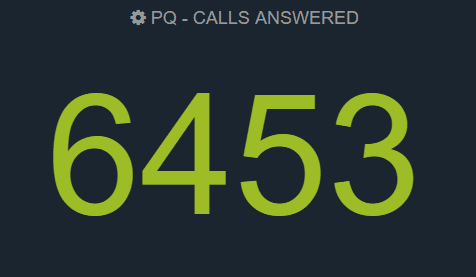
Calls Answered
![Comstice Wallboard Widgets for Cisco UCCE]()
Total number of calls answered based on the selected precision queues.
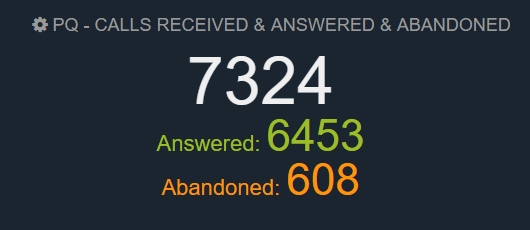
Calls Received, Answered and Abandoned
![Comstice Wallboard Widgets for Cisco UCCE]()
Total number of calls received, answered and abandoned based on the selected precision queues.
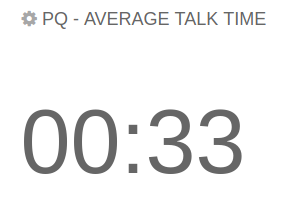
Average Talk Time
![Comstice Wallboard Widgets for Cisco UCCE]()
Weighted average of the average talk times of the selected precision queues.
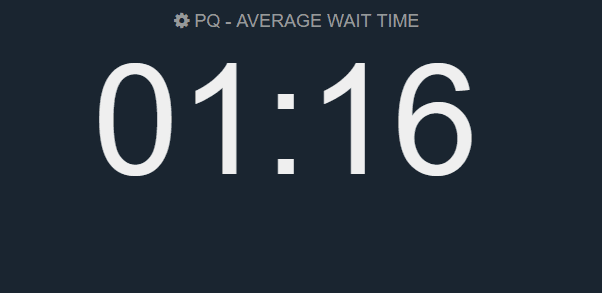
Average Wait Time
![Comstice Wallboard Widgets for Cisco UCCE]()
Weighted average of the average wait times of the selected precision queues.
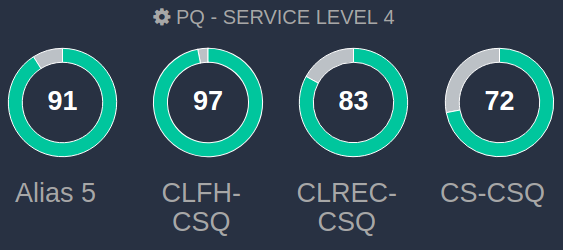
Service Level 4, 8 Donut
![Comstice Wallboard Widgets for Cisco UCCE]()
Individual call type service levels in a donut chart with two threshold options for visual alerts. Chart goes amber when the first threshold hit and becomes red when the second threshold is achieved. Second threshold must be less than the first threshold value.
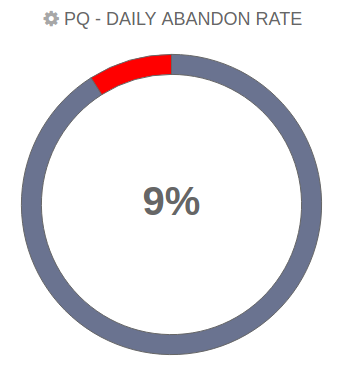
Daily Abandon Rate (Donut)
![Comstice Wallboard Widgets for Cisco UCCE]()
This widget shows the percentage of abandoned calls that day with respect to the calls offered. Users also have the option to ignore the call types which have neither answered nor abandoned calls i.e. transient calltypes.
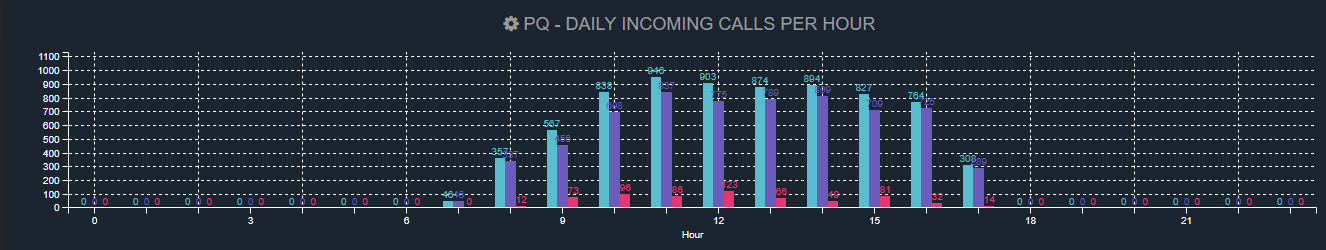
Daily Incoming Calls Hourly
![Comstice Wallboard Widgets for Cisco UCCE]()
This hourly chart gathers the data from the calltype interval tables. Interval tables populate the data in the beginning of each hour and half hours by default.
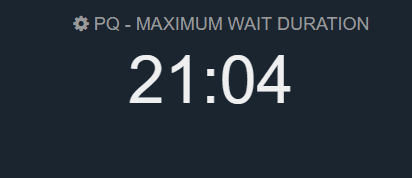
Maximum Wait Time
![Comstice Wallboard Widgets for Cisco UCCE]()
Longest wait time of the callers waited in the calltype queues. This is not the currently waiting call but the longest time a caller waited on that day.
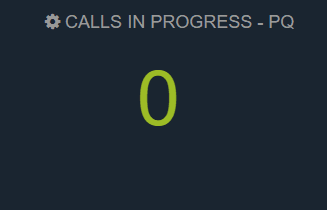
Calls in Progress
![Comstice Wallboard Widgets for Cisco UCCE]()
Number of calls which are being handled by the agents for the selected calltypes.
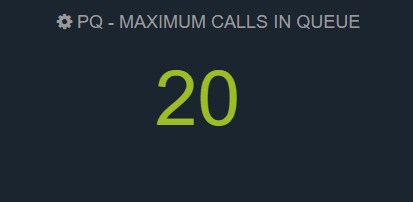
Max Calls in Queue
![Comstice Wallboard Widgets for Cisco UCCE]()
This is the maximum number of calls in queue achieved for the selected queues on that day. This is not the total number of calls currently waiting.
OtherOther
Comstice Wallboard can present third party data along with Cisco real-time daily historical data.
Third party data such as ServiceNow, SalesForce, ZenDesk and similar ticketing systems can be presentedas widgets.