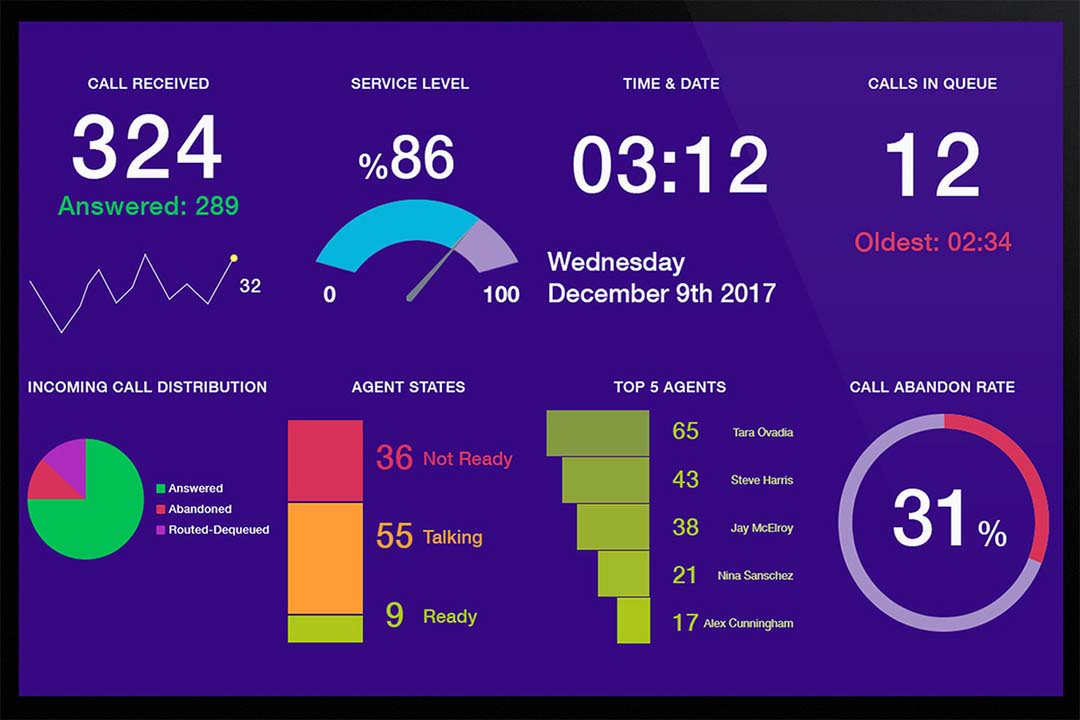
Steps to create new dashboards, real-time alerts and notifications
Comstice Wallboard helps to monitor real-time and daily historical contact center activity and performance. It can also send real-time notifications via SMS and e-mail, based on your thresholds. It offers three main interfaces to access the real-time data; web interface, mobile app and desktop ticker app.
Comstice Wallboard App is available at Apple AppStore and Google Play Store.
Comstice Wallboard supports Avaya (Elite CMS, Aura ACCS , and Select.)
Scan the barcode to download Comstice Wallboard app
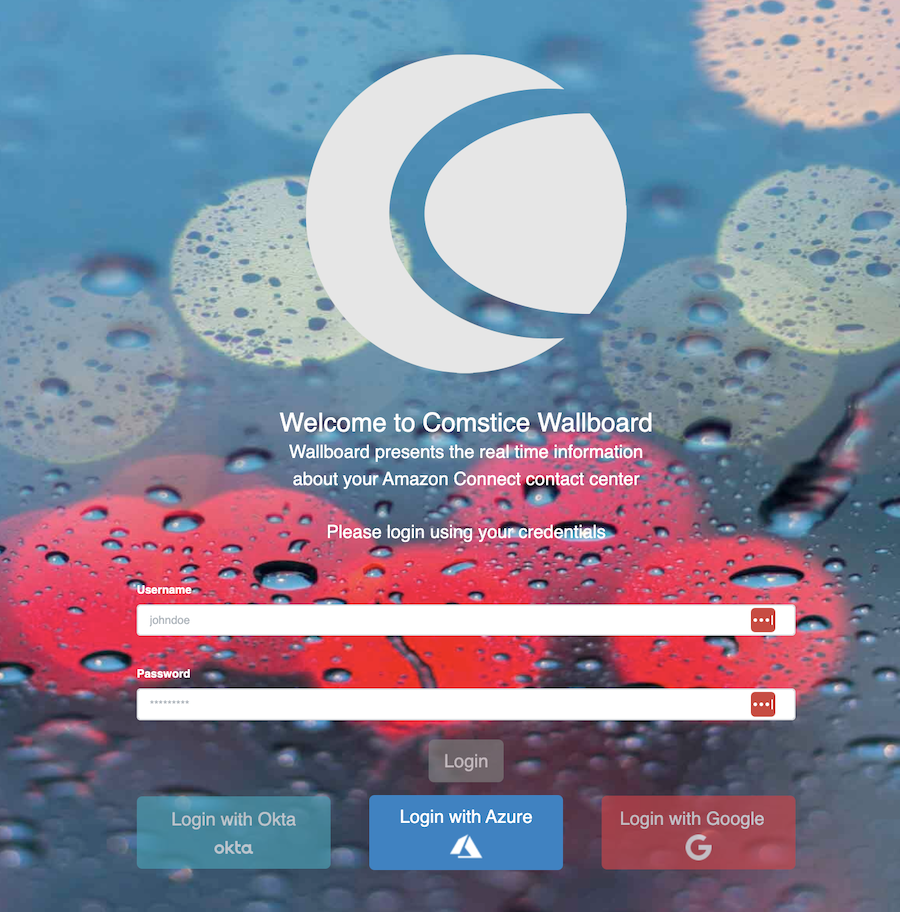
Wallboard Web Login
You can login to Comstice Wallboard web interface using the link provided by your IT team. For Avaya, your IT team can create user accounts or single sign-on can be used if enabled.
http://wallboard.example.com
Widget View
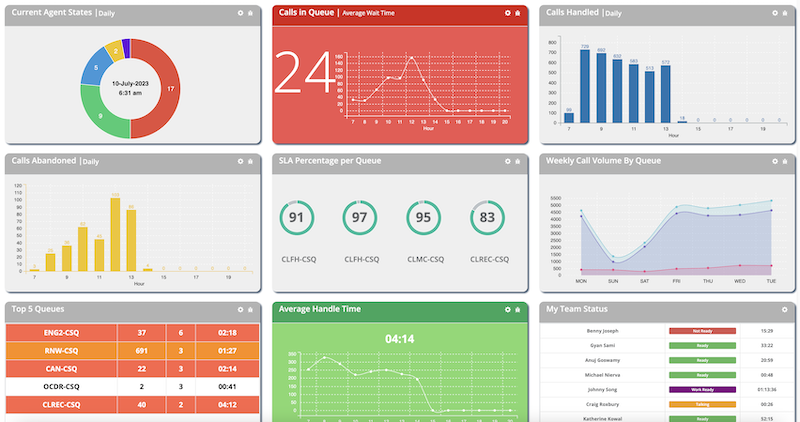
Once you login, you will be able to see the Widget View in the side menu on the left. There are some pre-designed templates, however Widget View helps to create your own Wallboard.
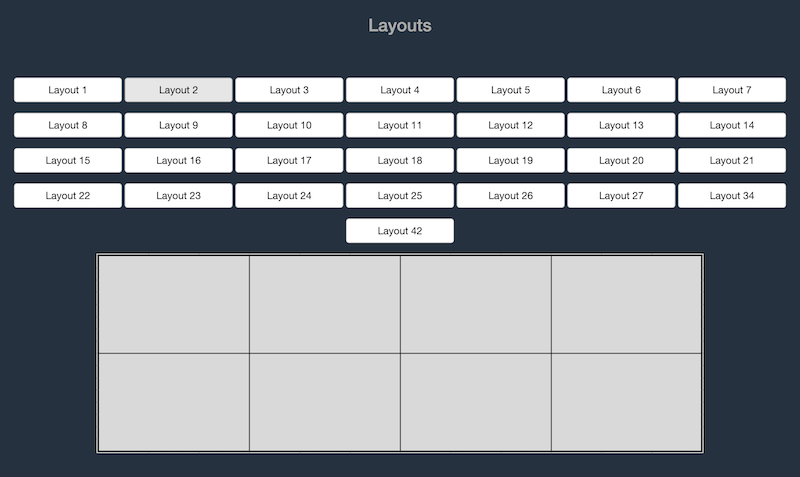
When you click on "Widget View" on the side menu, there are some dashboard templates available. You can hover your mouse over each template button and see each layout design; each template includes boxes that you can insert key performance indicators as widgets.
Click on the template button you choose and you will access to the template that you can customize. You can click on each "+" icon and select widgets from the dropdown list.

There is a list of widgets available, for the call center model used. Here are some example dashboards designed using the widgets available. You can choose widgets based on the size of each box.
Update Widget Settings
Each widget has its own settings; you can click on the gauge/settings icon on the widget title and filter your data. You can select the agents, splits and vdns of your choice. For the agent widgets, it is recommended to filter based on the skills or agent teams. Whenadd/remove agent from the skills or teams, the widget will be updated automatically.
Updating Thresholds
Some widgets have thresholds that you can set. Once the data hits those thresholds, the widget will change colors to alert the users.

You can click on the widget settings and adjust the thresholds accordingly.
Adjusting Widget Fonts
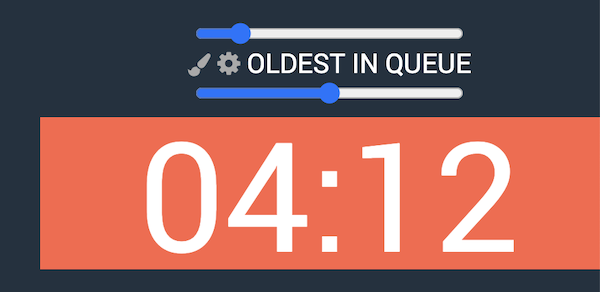
You can click on the widget title and adjust the font size of the title and the content of each widget using the sliders. Top slider is for adjusting the title and the bottom slider is for adjusting the content.
Once you are done, click on the widget title again to hide the sliders. Font adjustment is stored locally on your browser cache. It needs to be set for each PC, since the screen size and the resolutions might be different.
Saving New Dashboard

Once you selected all the widgets and updated their settings, you need to save the dashboard. Click on "Save Page" button on the top right corner and the dashboard will be saved.
Saved dashboard will be listed on the side menu as a saved layout. You can also share the weblink of your new dashboard with others.
Editing Saved Dashboard

There is an order you need to follow to edit the existing dashboard;
- Select the saved dashboard from the side menu
- Click on "Edit" button on the top left
- If you want to replace one of the widgets, click on the "X" on the top left corner of the widget box and remove it. Then select another widget from the list. If you want to only edit the settings of the widget, click on the settings/gauge icon of the widget, then click on "Save" to update your settings.
- Finally, click on the Save button at the top left coner of the page.

Sharing Dashboard
There are two types of sharing; You can share the weblink of the saved dashboard with others and they can access to the dashboard without any login. However, they will not be able to make any changes.

You can also "copy" your dashboard to another user's account. On the side menu, click on the "+" icon next to your dashboard. Then enter the username of the wallboard user you want to share the dashboard.

Scrolling Team Messages

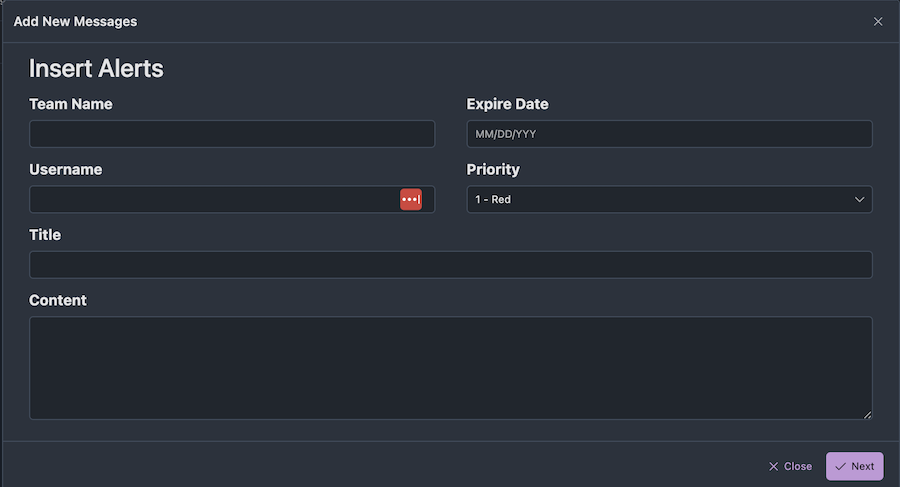
You can create multiple messages for your team members and display them on the wallboard using "Scrolling Message" widget. On the side menu, select Notification Center and create messages for your team.

Each message has;
- Team Name: This is used to group messages for different teams. You can filter the messages in the widget for selected teams.
- Expiry Date: After this date, the message will not appear. To show a message only for today, select expiry date as tomorrow.
- Priority: There are three priority levels 1, 2 and 3. Each will color-code the message.
- Title: It is not visible on the message. Only used in the message listing
- Content: This is the actual message. You can type it in any language and alphabet
- Username: Enter your username to save the message.
Conclusion
Comstice Wallboard helps customer service managers and call center agents to monitor real-time activity and get alerted when the thresholds are reached. You can request live training session from your IT for further details.

