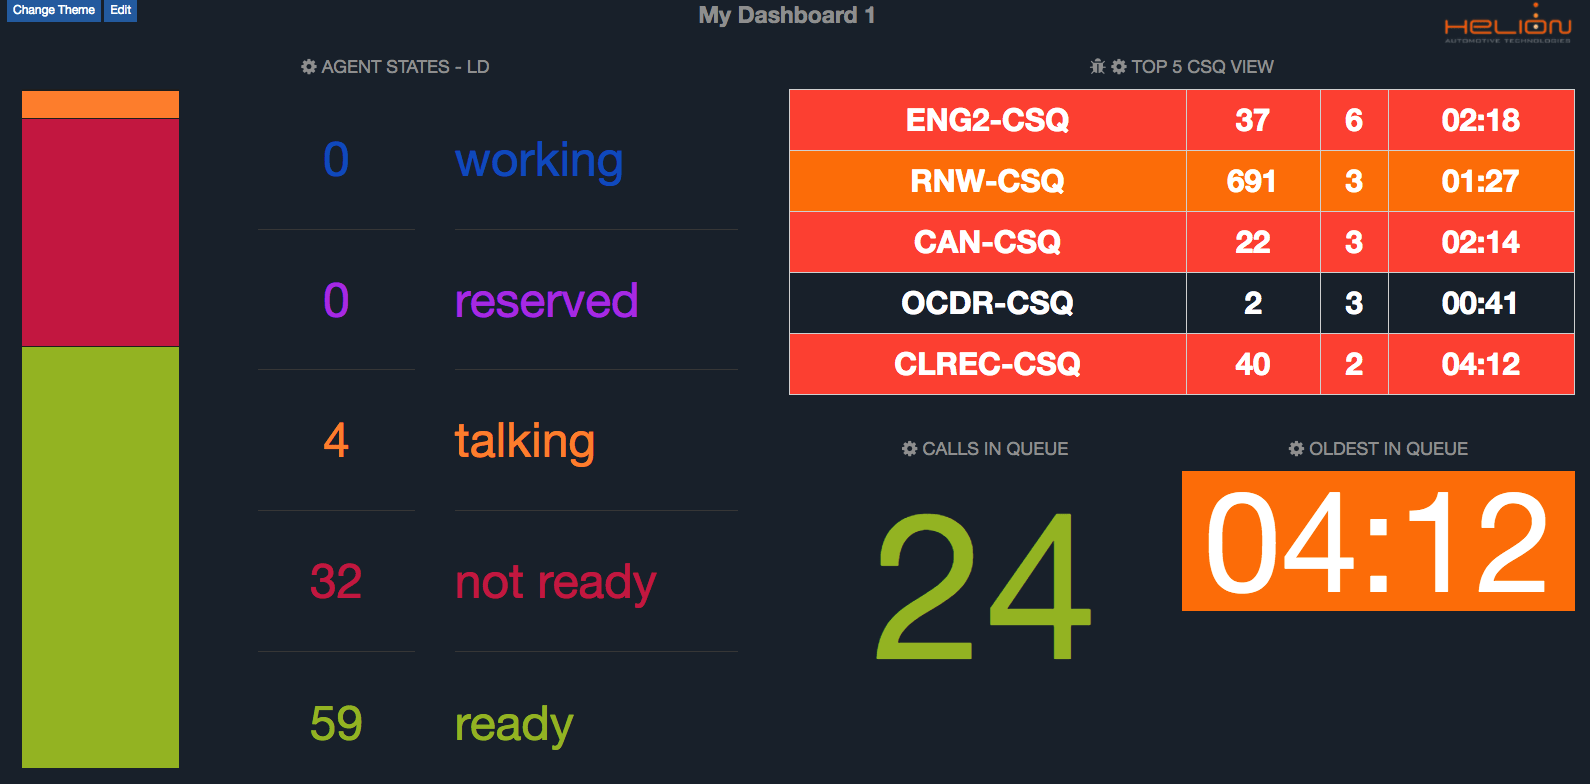
Over the years, we worked with many large call centers for better reporting and analytics. Here are the top ten reports we were asked to build in order to optimise contact center performance;
Heatmaps
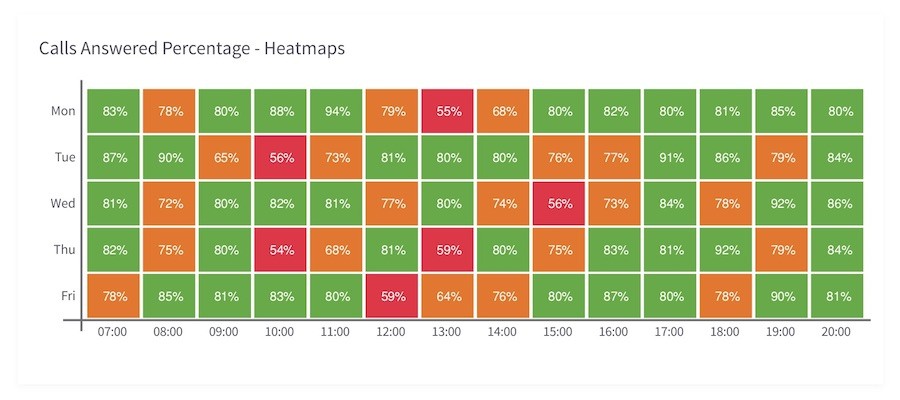
Heatmaps are used to analyze the indicators for the last 8-12 week period for each hour in the days of the week. There are used in two ways;
- Displaying average value of the indicator for the each hour of the week for the last 8-12 weeks and show where performance falls below the defined thresholds consistently
- Visualizing percentage distribution of the calls received, answered and abandoned to show which hours of the days call volumes are peaking for the same period
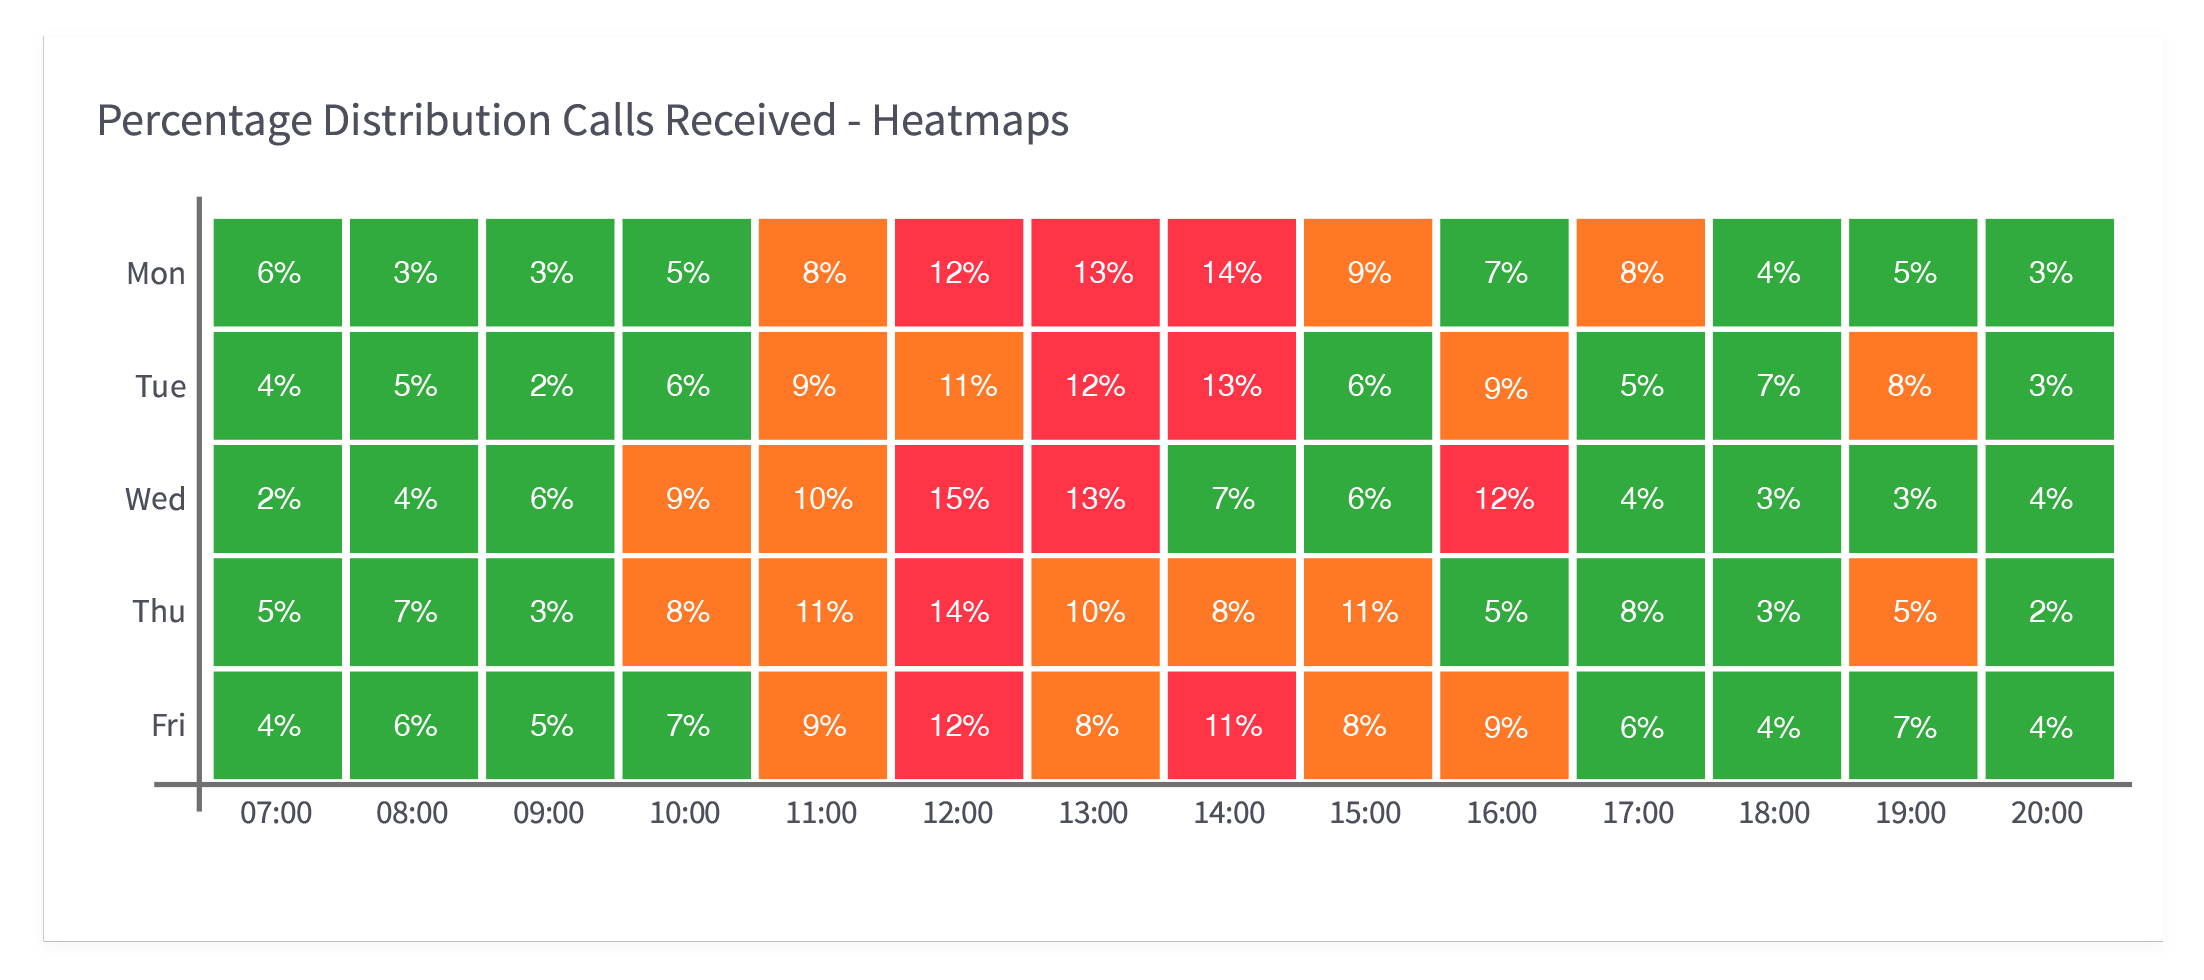
Heatmaps are used in forecasting for more accurate agent staffing and higher agent occupancy.
Repetitive Calls Analysis
It is often overlooked how many customers called the call center multiple times in a short period of time. Repetitive Calls Analysis shows the calling numbers making calls more than the defined number during the day. It also analyzes each repetitive caller's pattern whether it is the caller behaviour or the number of repetitive calls has peaked during a specific time period.
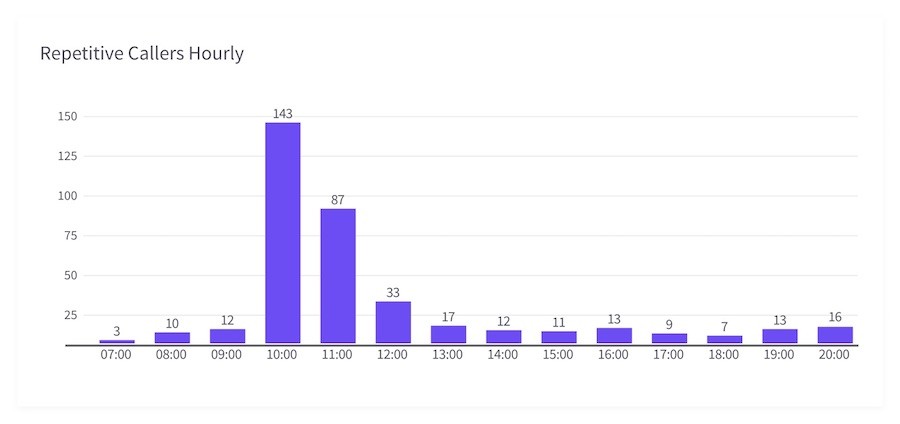
Repetitive Calls Analysis often used to find out about technical issues, cumbersome IVR menu options and malicious callers.
Year on Year Performance Analysis
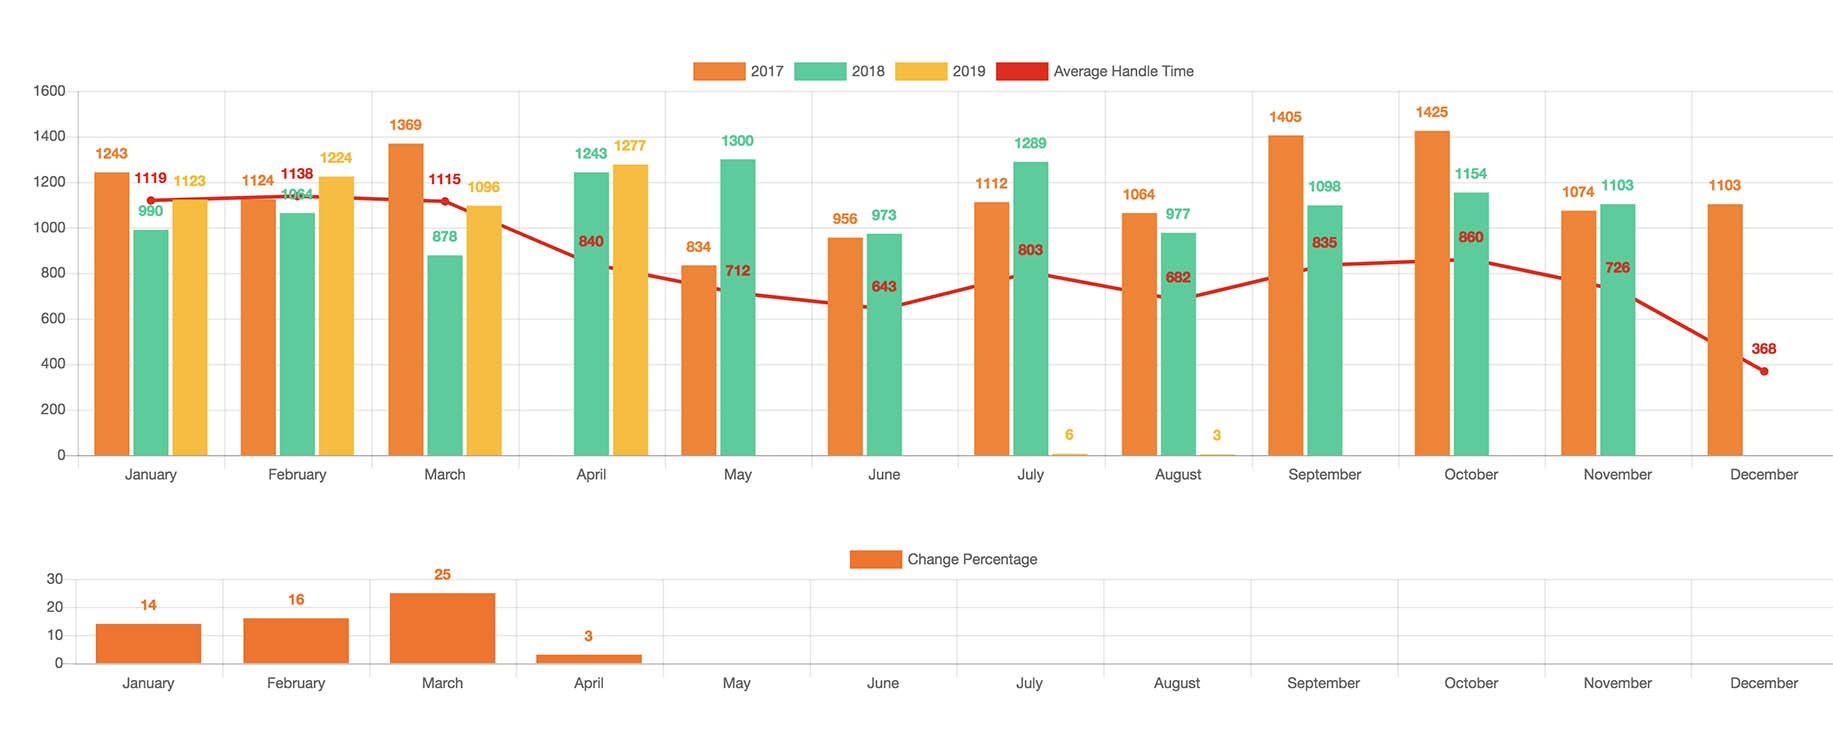
YoY Analysis shows the performance indicators monthly for the last few years and displays the rate of change between the last two years. Using this rate of change values, businesses forecast the potential value of the performance indicator such as call volumes for the coming months.
Year on Year (YoY)
Comstice Wallboard can present third party data along with Cisco
real-time daily historical data.
Third party data such as ServiceNow, SalesForce, ZenDesk and
similar ticketing systems can be presented as widgets.

Weekly, Monthly, Quarterly
There are bar charts available for weekly, monthly and quarterly data to visualise any pattern available or any peaks. Using the drilldown feature you, can go into the details of the particular time period to further analyze the data;
Call Received, Answered, Abandoned

This widget displays monthly received, answered and abandoned calls.
Abandoned Calls Callback Engine
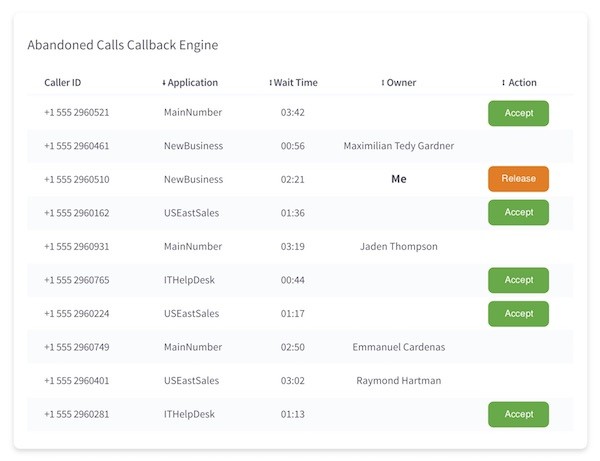
This is more of a utility than just a report. It shows every single call recently abandoned in the queue. Agents can assign some of those calls to themselves and make callbacks when they are not busy. Once an abandoned caller is assigned to an agent, other agents can not assign the contact to themselves, which eliminates multiple agents calling the same lead. This utility is often used in direct revenue generating skills such as sales, new business, renewals to convert the lead into a revenue quickly.
IVR Containment Analysis
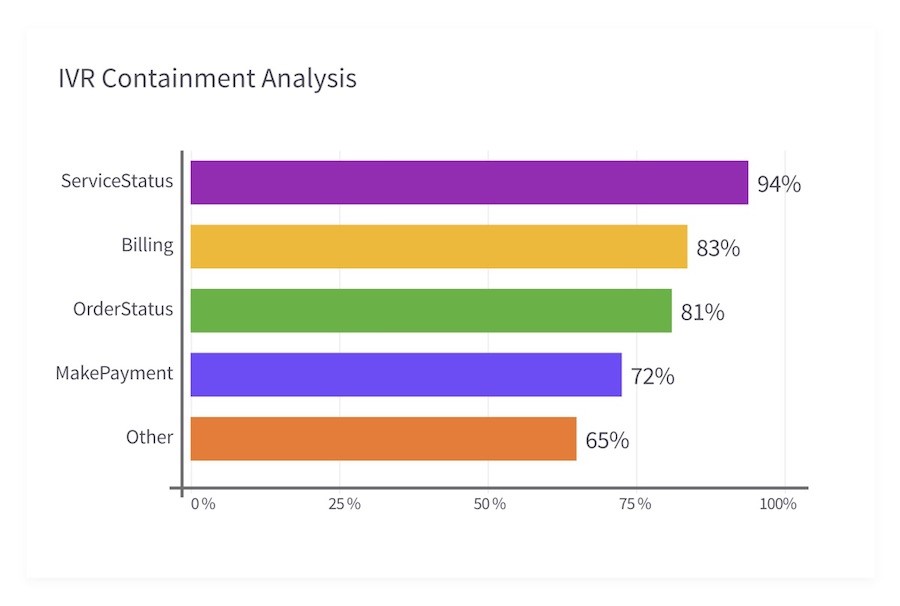
Many businesses create self-service features to minimize the calls sent to the agents. This report helps to visualise the performance of the IVR features and shows the percentage of the calls contained in the IVR. It is often used to optimise the IVR flows and the caller experience.
Customer Patience Index
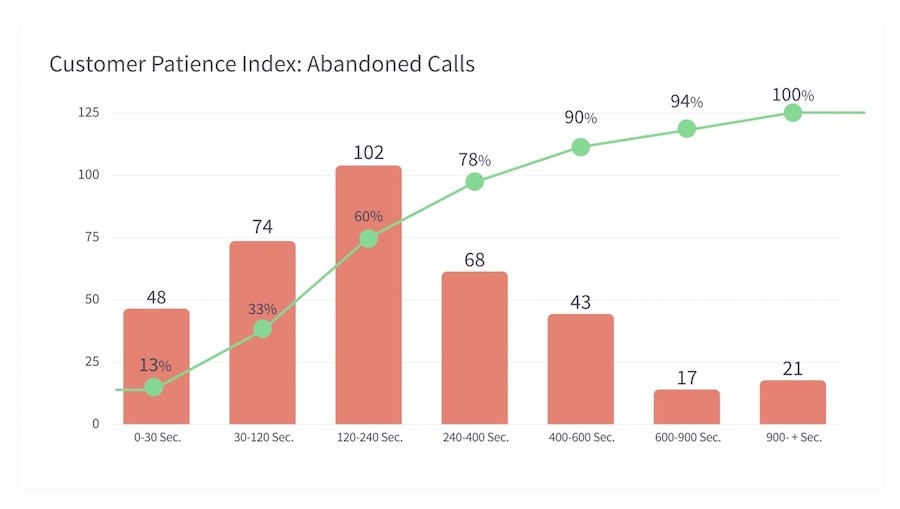
Customer Patience Index shows the abandoned calls and their percentages on each bucket, predefined time intervals for clasifying abandoned calls. It can also show the Erlang A forecast vs the actual value itself to see the percentage of divergence.
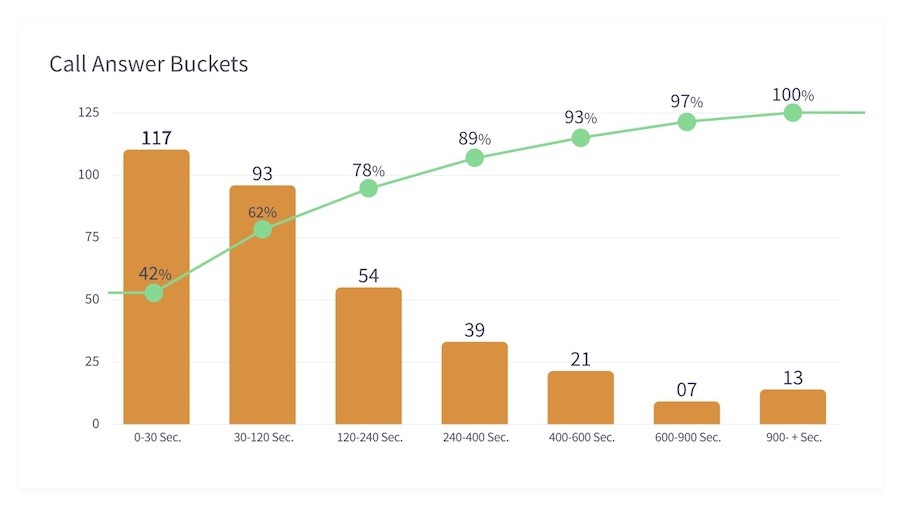
Calls Answered Buckets
This report helps to identify the call wait time pattern for the answered calls. This is often used to improve the service levels by notifying the agents about the wait times.
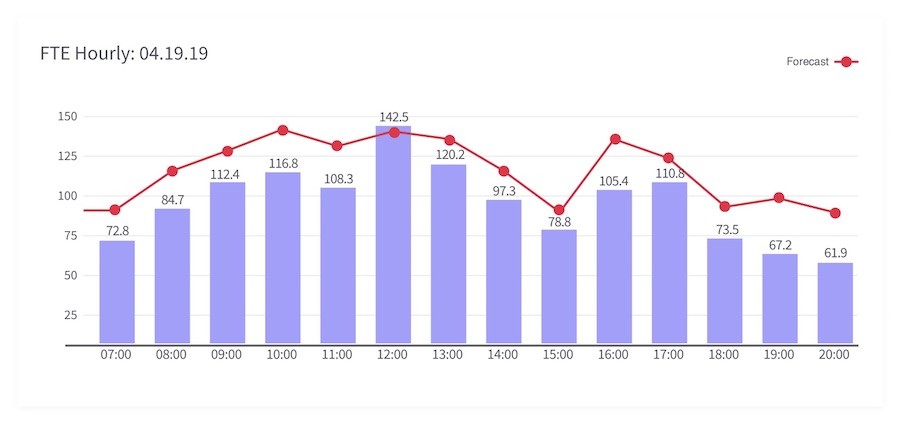
Hourly FTE Count
FTE (Full-time Employee) count is the total number of minutes of the agent login times for the specific hour divided by 60. It is often used to show the actual scheduled agents since not all of the scheduled agents may be available. Along with heatmaps, they are used to optimise the resource scheduling.
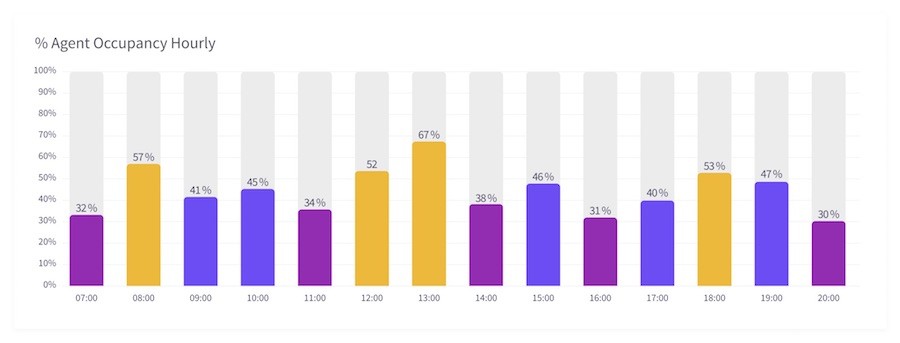
% Agent Occupancy Hourly, Daily Monthly
This report shows the percentage of the agent time spent on customer calls. It often includes the talktime, holdtime and after call work time of the agent for each call. This is an important indicator for measuring the accuracy of the resource forecasting. In some cases this may also include the time spent in AUX but for making callbacks.
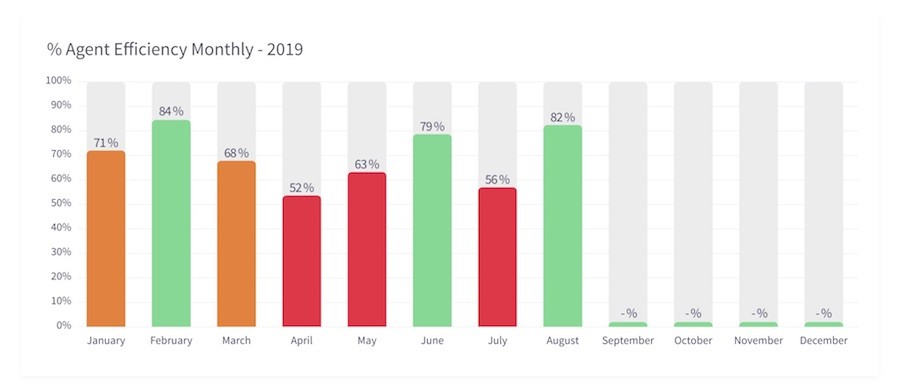
% Agent Efficiency Hourly, Daily Monthly
This indicator is used to measure agent availability and the readiness for the tasks. Agent is considered efficient when she is in available/ready along with the time spent to handle customer calls.
Call Result Codes
These codes are selected by the agent or assigned automatically. They show any potential issues on the call and often used to identify the infrastructure related issues.

Conclusion
Contact centers are resource intensive operations. Simple efficiency changes or identifying a weakness early helps to reduce the costs and improve customer experience. Using the specialist applications, you can visualize the vast amount of data contact centers generate, access meaningful data easily and resolve the bottlenecks quickly.
Comstice is a technology provider specializing contact center solutions supporting Avaya (DevConnect Partner), Cisco (Preferred Solution Partner), Genesys and Amazon Connect. Above reports are available out of the box in Comstice Quartz Reporting and Analytics platform.

